
Expansion triangle consolidation and mBDSR (RCI2-band filter) pullback buy signal
New!!※May 4, 2024About major indicators of 【mBDSR】 version upgradehas been carried out.
Alerts can now be triggered not only for arrow signs but also when star signs illuminate for the first time.
Also,4k monitor supportallows for even larger display of arrows and star signs.
For more details, please see the article below on Investment Navi+.
About the version upgrade of the major indicators of mBDSR
https://www.gogojungle.co.jp/finance/navi/articles/69373
In recent Investment Navi+ articles,you can see many examples that illustrate the strong compatibility between various trading methods and mBDSR signals.
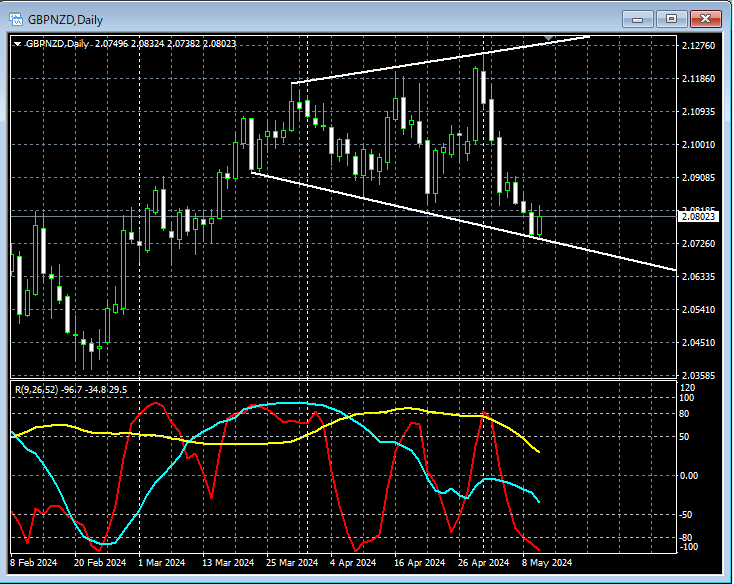
GBPNZD Daily
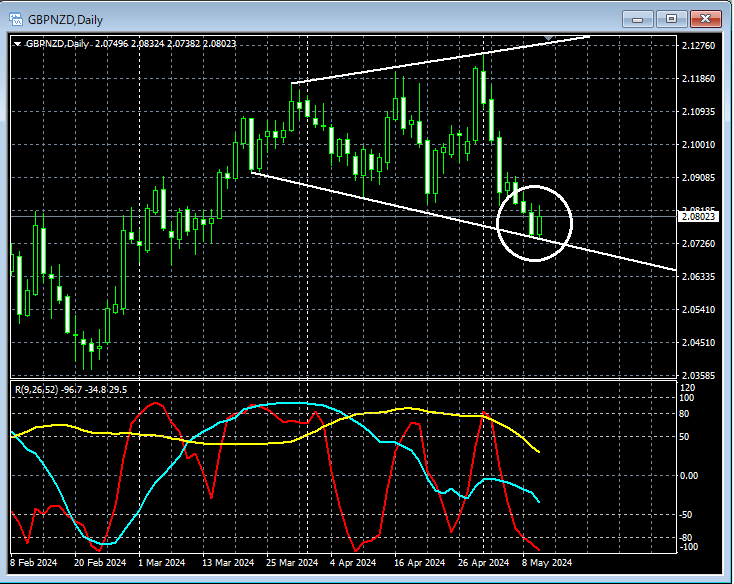
If you look at the area circled by the white circle on the above daily chart,expanding triangle consolidationhas moved down toward the lower bound. From here, it might not be surprising to consider a rise.
GBPNZD 5-minute
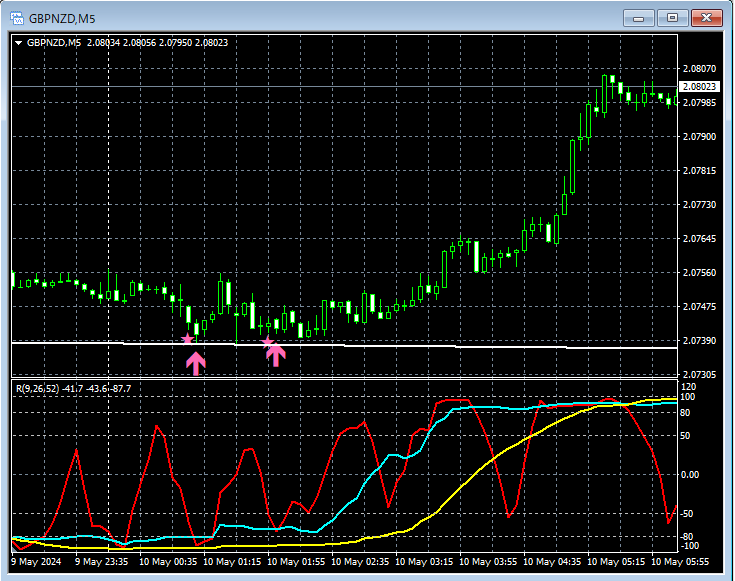
On the 5-minute chart above,expanding triangle consolidationnear its lower boundmBDSR (Filter: RCI26 and RCI52)buy-the-dip signal lights up, and prices subsequently rise steadily.
From this example,a trading method focused on the expanding triangle consolidationandthe signals of mBDSRshow a strong synergy.
Indicators that excel when combined with RCI【BODSOR・mBDSR】
and their method and case studies (PDF) ★GogoJungle AWARD2020 winner★
https://www.gogojungle.co.jp/tools/indicators/11836
A PDF file containing 301 documents (over 1,000 pages, over 350,000 characters in total).
Most of them are laid out as examples that outline the process of logically linking higher and lower timeframes using three RCI lines, and ultimately waiting for pullbacks or retracements on the lower timeframe (i.e., mBDSR signals).Additionally,
.
The explanations use.

Alerts can now be triggered not only for arrow signs but also when star signs illuminate for the first time.
Also,4k monitor supportallows for even larger display of arrows and star signs.
For more details, please see the article below on Investment Navi+.
About the version upgrade of the major indicators of mBDSR
https://www.gogojungle.co.jp/finance/navi/articles/69373
In recent Investment Navi+ articles,you can see many examples that illustrate the strong compatibility between various trading methods and mBDSR signals.
GBPNZD Daily
If you look at the area circled by the white circle on the above daily chart,expanding triangle consolidationhas moved down toward the lower bound. From here, it might not be surprising to consider a rise.
GBPNZD 5-minute
On the 5-minute chart above,expanding triangle consolidationnear its lower boundmBDSR (Filter: RCI26 and RCI52)buy-the-dip signal lights up, and prices subsequently rise steadily.
From this example,a trading method focused on the expanding triangle consolidationandthe signals of mBDSRshow a strong synergy.
Indicators that excel when combined with RCI【BODSOR・mBDSR】
and their method and case studies (PDF) ★GogoJungle AWARD2020 winner★
https://www.gogojungle.co.jp/tools/indicators/11836
A PDF file containing 301 documents (over 1,000 pages, over 350,000 characters in total).
Most of them are laid out as examples that outline the process of logically linking higher and lower timeframes using three RCI lines, and ultimately waiting for pullbacks or retracements on the lower timeframe (i.e., mBDSR signals).Additionally,
.
The explanations use.