
Try displaying technical indicators
It is Geko.
In the previous articles,
we learned that the market has trends (upward or downward) and ranging conditions.
However, when you actually look at the chart in motion, it is very difficult to determine whether a trend is currently present or if the market is ranging.
As with the images in the previous article, such judgments can only be read from historical charts.
So, how do we read the market situation?
As one hint, let’s display a thing called a technical indicator (indicator).
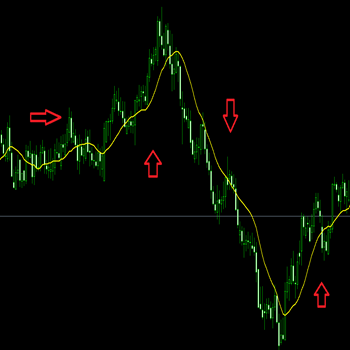
This image shows a moving average line (period 14).
This line is derived by calculating the average of the closing prices of the past 14 candlesticks in order.
From this perspective, by looking at the position relationship between the moving average line and price movement (candlesticks), it seems possible to judge trends or ranges.
For example, the following trades can be considered.
- If the candlestick closes above the moving average, buy; if it closes below, close the position
- If the candlestick closes below the moving average, sell; if it closes above, close the position
In reality, there are many patterns, so it isn’t simple, but it may provide some hints.
When developing automated trading systems (EAs),
everything starts from thinking about patterns that could generate profit from the chart’s price movement like this,
and that is where it all begins.
This aspect may be the same as discretionary trading.