

【BTCJPY】20180925 Daily Pivot
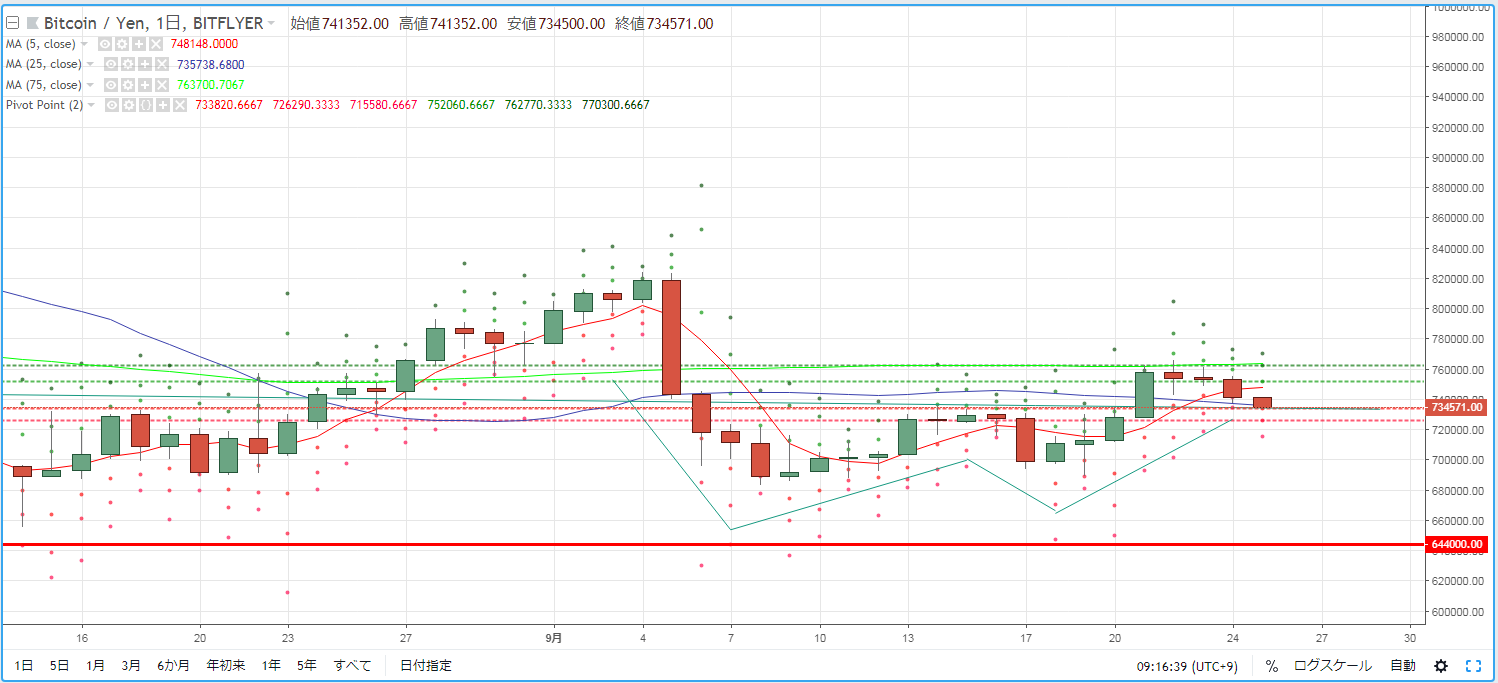
As a guideline for day trading BTCJPY, we check the pivot. Yesterday (September 24) there was strong selling pressure, broke below the 5MA and reached the 25MA. There, the decline halted, and the market closed after a small rebound.
R2=762,770
R1=752,060
S1=733,820
S2=726,290
※ A pivot point is a technical indicator used to predict the price movement range for the day based on the previous day's price action. Centered on the Pivot Point (PP), draw resistance lines (R1, R2) and support lines (S1, S2) above and below, and use them as trading references.
【Calculation Formula】
Pivot Point (PP) = (Previous day’s close + previous day’s high + previous day’s low) / 3
Resistance Line 1 (R1) = PP + (PP - previous day’s low)
Support Line 1 (S1) = PP - (previous day’s high - PP)
Resistance Line 2 (R2) = PP + (previous day’s high - previous day’s low)
Support Line 2 (S2) = PP - (previous day’s high - previous day’s low)


