

Case that captured the bottom and top using a harmonic butterfly pattern
Hello!
I am Satori, researching FX.
Today I will deliver a case study on “capturing a market bottom with the Harmonic Butterfly Pattern.”
The figure below shows a Bullish Butterfly Pattern (blue butterfly shape) detected on the USDJPY 1-hour chart, which is said to have a high possibility of catching a bottom.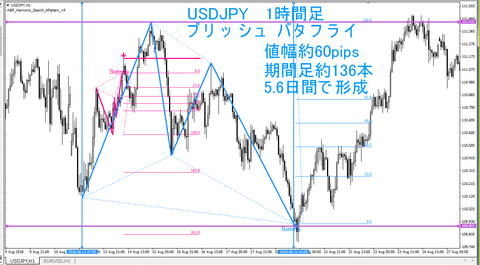
http://livedoor.blogimg.jp/fxmt4indicator/imgs/6/1/61833e0d.gif
The pattern width is about 50 pips, and the formation took 136 bars.
From August 13 to 21, 2018, about a week, it formed over 5.6 trading days.
After forming the Bullish Butterfly Pattern, there was a strong rebound and a full retracement of about 50 pips.
The pink small reverse-shaped form is a Bearish Butterfly Pattern, but since the formation period is short, it is hard to say it is very effective.
The figure below shows a Bearish Butterfly Pattern (pink butterfly shape) detected on the EURUSD 1-hour chart, which is said to have a high possibility of catching a peak.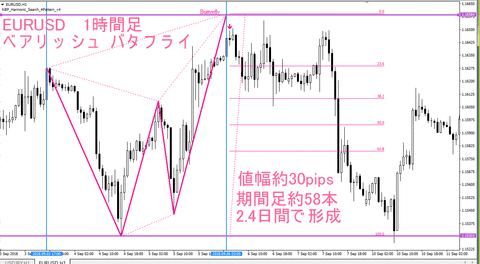
http://livedoor.blogimg.jp/fxmt4indicator/imgs/0/8/083d8065.gif
The pattern width is about 30 pips, and the formation took 58 bars.
It formed from September 3 to 6, 2018, in about 2.4 days.
After forming the Bearish Butterfly Pattern, it consolidated and then fell, retracing about 30 pips.
Thus, on the 1-hour chart, there seems to be some effectiveness for patterns that take roughly 2 days and more than about 50 bars to form.
Today’s video is here.
https://youtu.be/aOb6YEhaSwQ
The indicators used today are as follows.


