

【BTCJPY】20180919 Daily Pivot
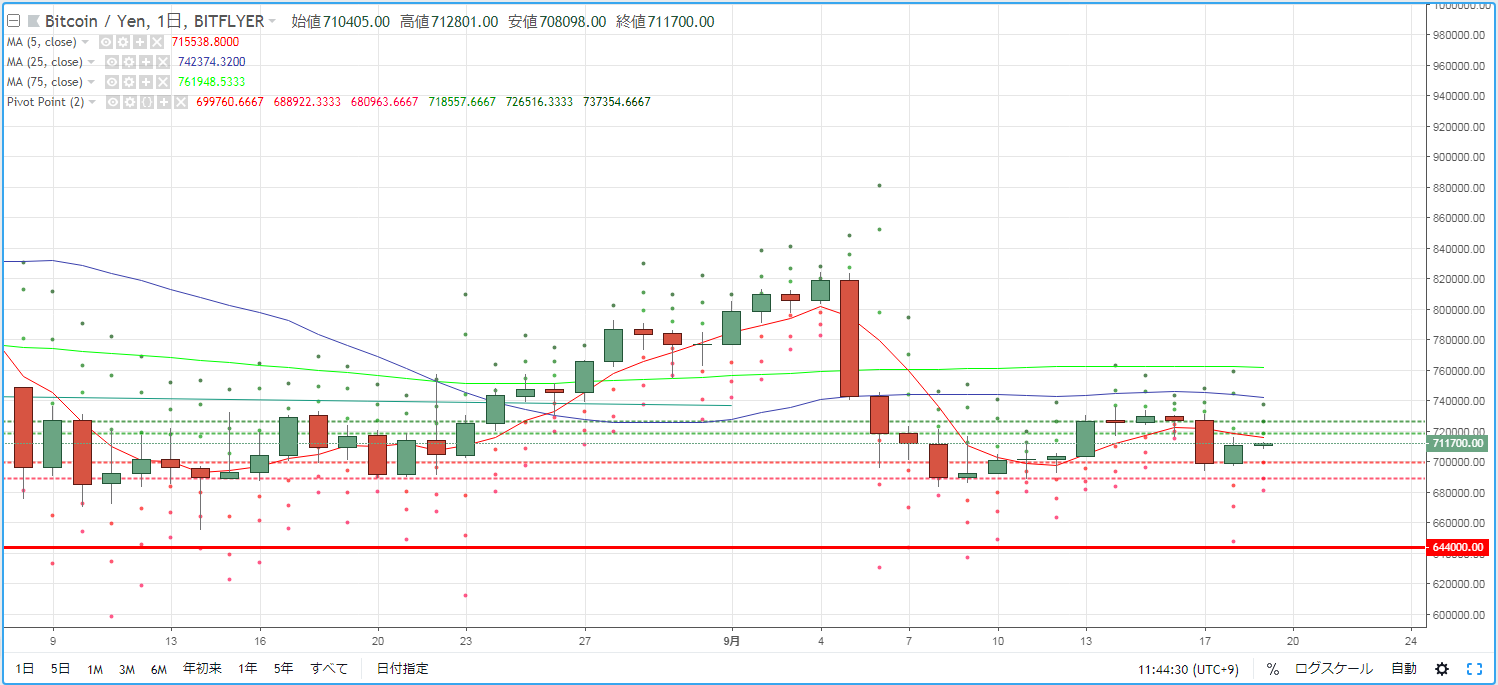
As a guideline for day trading BTCJPY, we look at the pivot. Yesterday (September 18) it turned up and recovered again to the 700,000 yen range. The market environment was one where the price was pushed back just before 720,000 yen where the 5MA is located.
R2=726,516
R1=718,557
S1=699,760
S2=688,922
※ A pivot is a technical indicator that predicts the price movement for the day based on the previous day's price action. Centered on the Pivot Point (PP), draw resistance lines (R1, R2) and support lines (S1, S2) above and below, and use them as trading guides.
【Calculation Formula】
Pivot Point (PP) = (Previous Day's Close + Previous Day's High + Previous Day's Low) / 3
Resistance Line 1 (R1) = PP + (PP - Previous Day's Low)
Support Line 1 (S1) = PP - (Previous Day's High - PP)
Resistance Line 2 (R2) = PP + (Previous Day's High - Previous Day's Low)
Support Line 2 (S2) = PP - (Previous Day's High - Previous Day's Low) (Please replace this part when sharing with the audience)


