

【BTCJPY】20180918 Daily Pivot
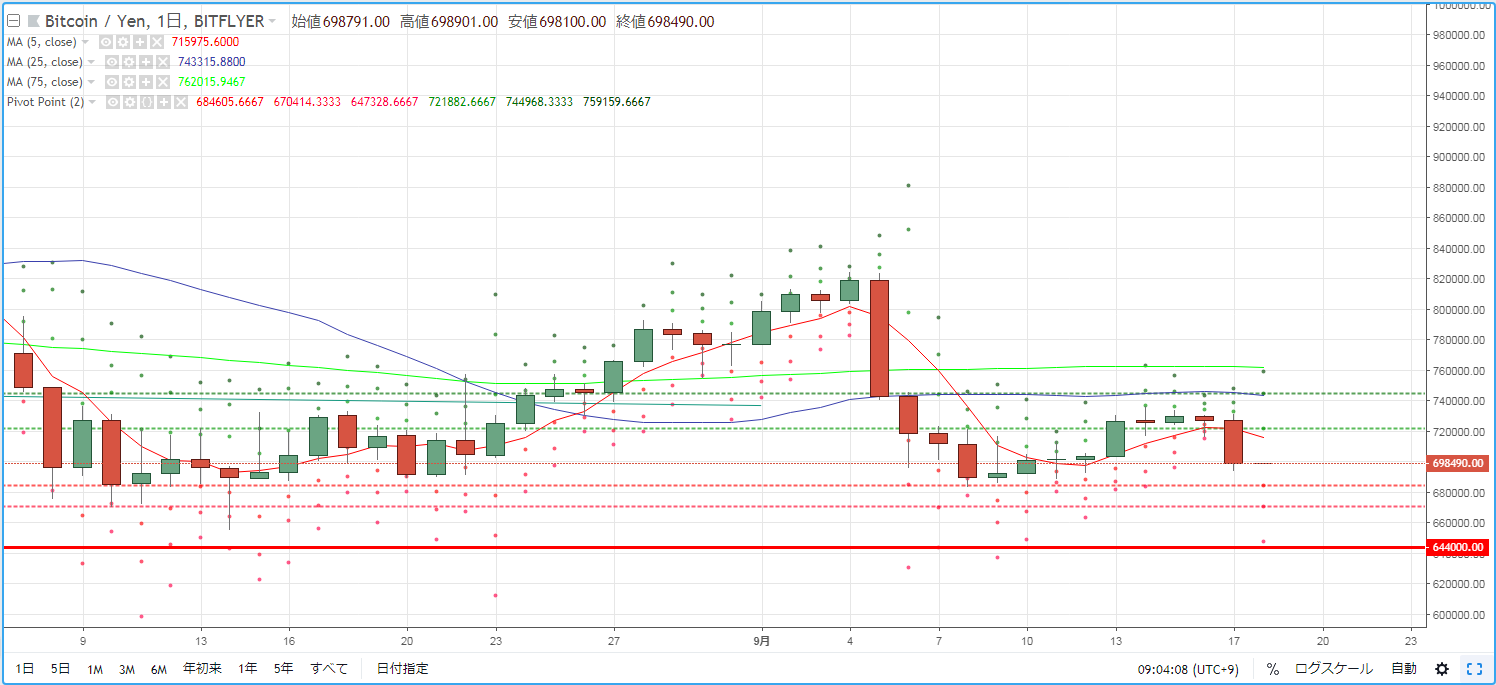
As a guide for day trading BTCJPY, we check the pivot. Yesterday (September 17), we created a bearish candlestick after breaking below the 5MA. The price once again fell below 700,000 yen, indicating a market environment that flushed out the rally from the 12th.
R2=744,968
R1=721,882
S1=684,605
S2=670,414
※ A pivot is a technical indicator that predicts the day’s price movement based on the previous day’s price action. Centered on the Pivot Point (PP), draw resistance lines (R1, R2) and support lines (S1, S2) above and below, and use them as trading references.
【Calculation Formula】
Pivot Point (PP) = (Previous Day's Close + Previous Day's High + Previous Day's Low) / 3
Resistance Line 1 (R1) = PP + (PP - Previous Day's Low)
Support Line 1 (S1) = PP - (Previous Day's High - PP)
Resistance Line 2 (R2) = PP + (Previous Day's High - Previous Day's Low)
Support Line 2 (S2) = PP - (Previous Day's High - Previous Day's Low)


