

【BTCJPY】20180913 Daily Pivot
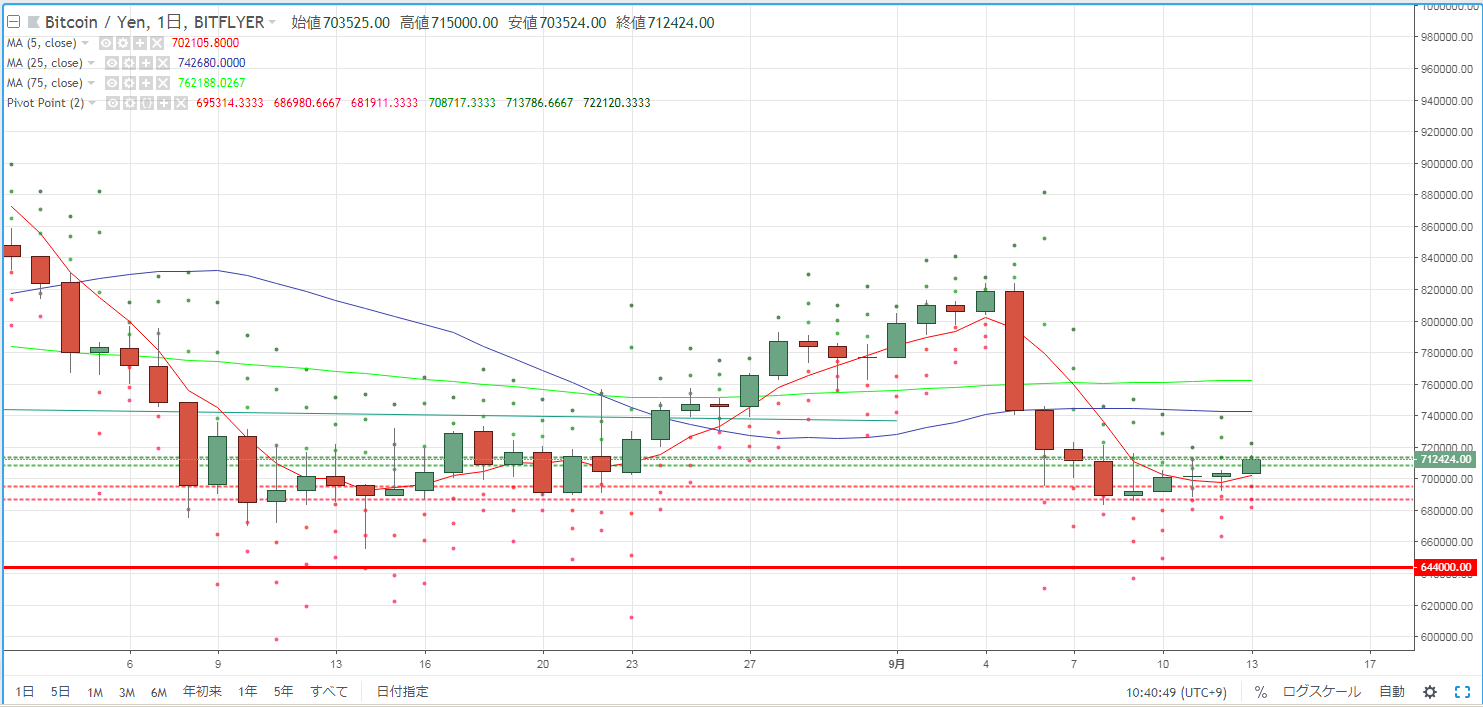
As a guideline for day trading BTCJPY, we check the pivot. Yesterday (September 12) showed no large price movement despite an bullish candle, and the market traded in the 690,000 to 700,000 yen range.
R2=713,786
R1=708,717
S1=695,314
S2=686,980
※ A pivot is a technical indicator that forecasts the price range for the current day based on the previous day's movement. Centered on the Pivot Point (PP), lines are drawn upward and downward as Resistance Lines (R1, R2) and Support Lines (S1, S2), and these are used as trading guidance.
【Calculations】
Pivot Point (PP) = (Previous Day Close + Previous Day High + Previous Day Low) / 3
Resistance Line 1 (R1) = PP + (PP - Previous Day Low)
Support Line 1 (S1) = PP - (Previous Day High - PP)
Resistance Line 2 (R2) = PP + (Previous Day High - Previous Day Low)
Support Line 2 (S2) = PP - (Previous Day High - Previous Day Low)


