

Can you identify tops and bottoms with MACD!?
In the previous article I wrote about the essence of MACD.
MACD is something that looks ahead at〇〇
This time, I will talk about how MACD makes it easier to read market tops and bottoms.
As before, only the MACD line will be displayed on the chart as we explain.
The red line is the 12-day EMA
The blue line is the 26-day EMA
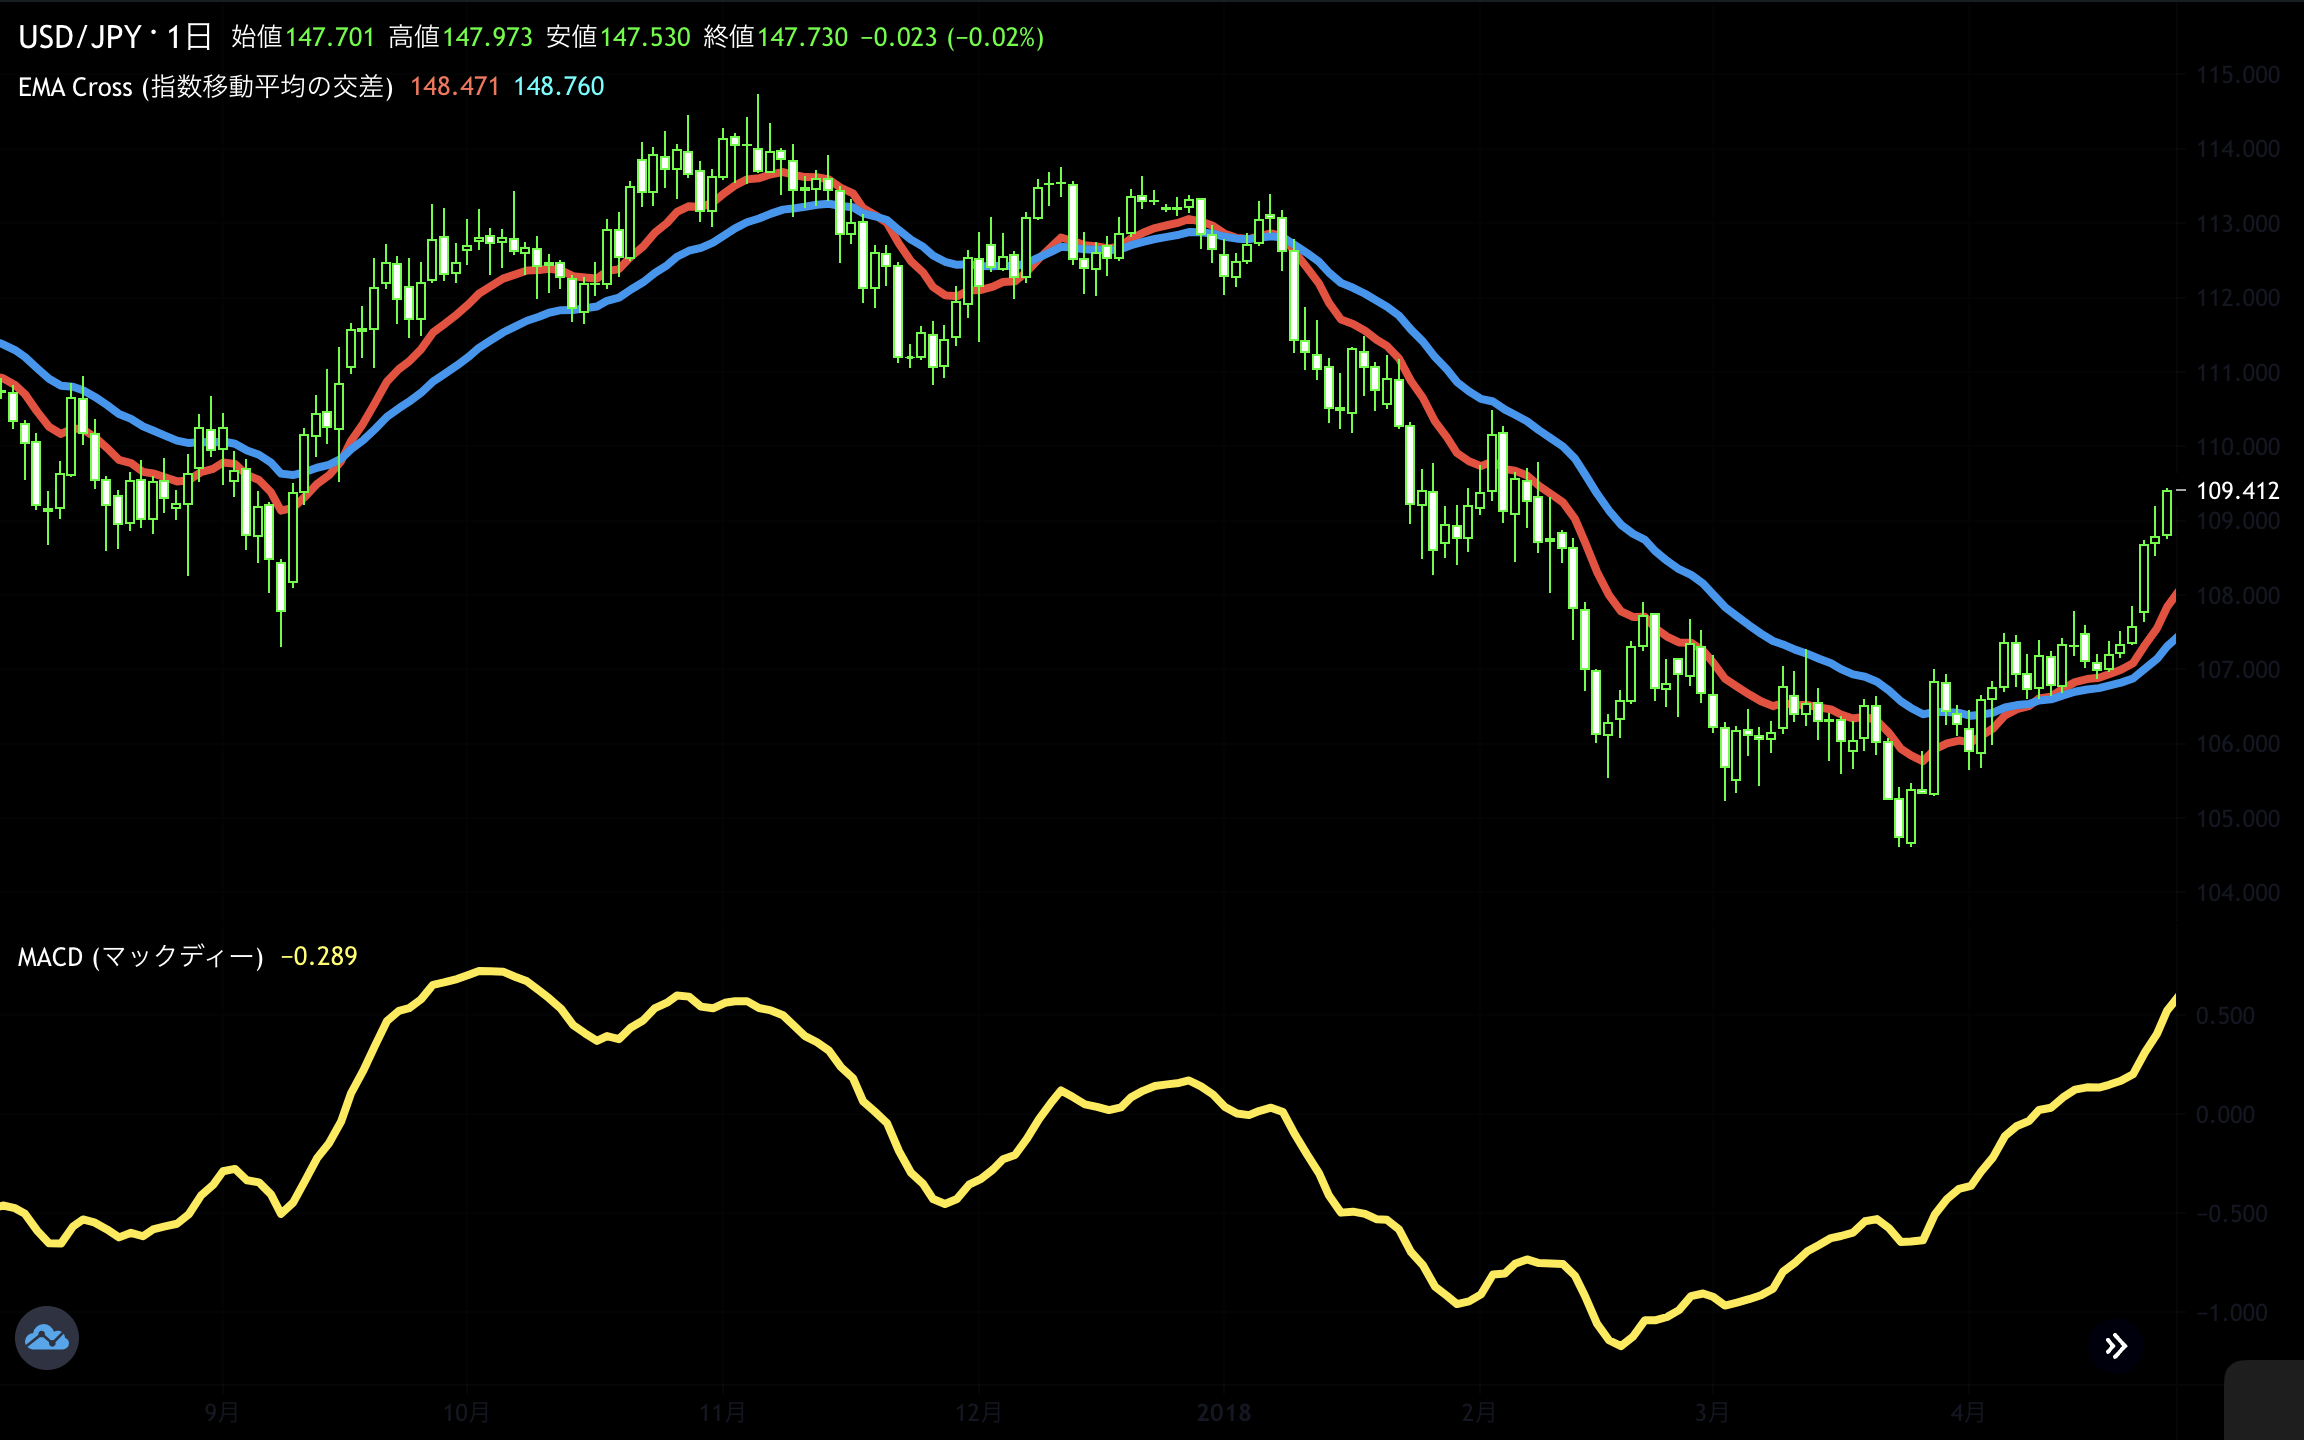
The definition of MACD is
MACD = short-term EMA − long-term EMA
In other words, MACD is an indicator that reads the change in the gap between two moving averages.
What does it mean for MACD to form a top or bottom?
It means the gap between the two moving averages has widened to its maximum.
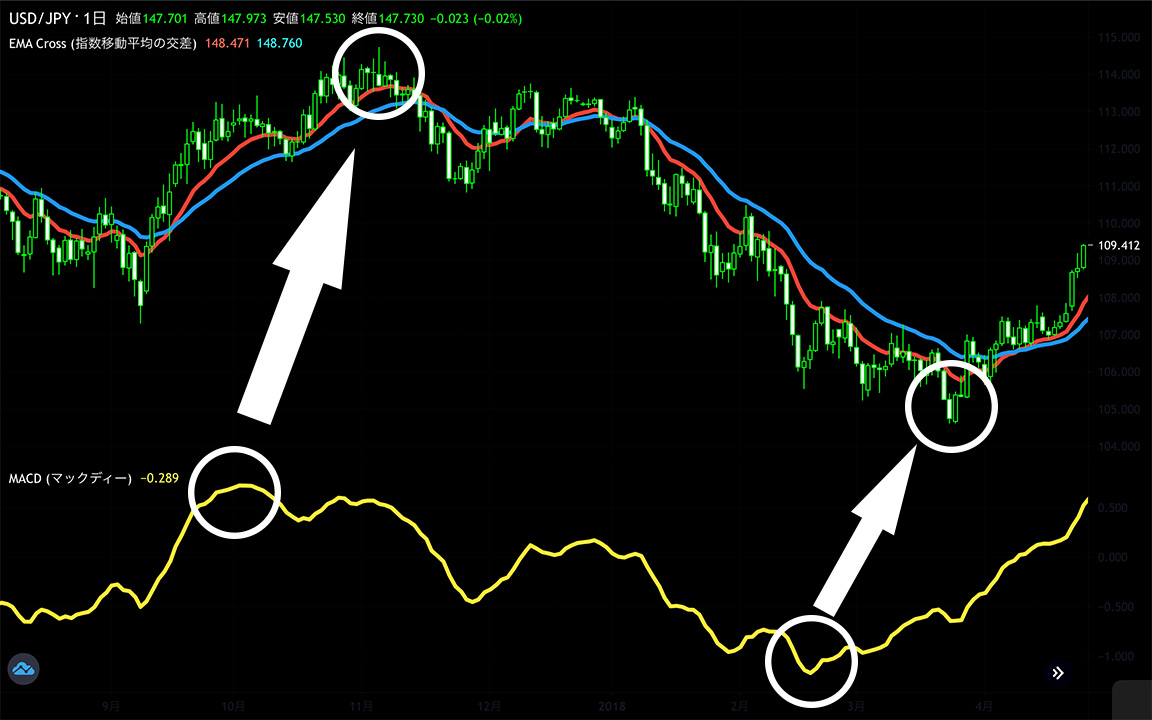
On the chart above, for clarity, I marked the tops and bottoms of price and MACD with circles.
When MACD hits a top, that is, after the difference between the two moving averages widens significantly, the price tops out and falls.
When MACD hits a bottom, after the difference between the two moving averages widens (in the negative direction), the price hits a bottom and rises.
What does it mean when MACD starts to go up from a downtrend? Previously, price had been rising, and when that uptrend loses momentum, the gap between the two moving averages narrows.
In other words, as price rises and MACD also rises, if the price’s upward momentum weakens before it tops out, MACD will top out first.
Conversely, what does it mean when MACD starts to rise from a downtrend? Previously, price had been falling, and as that downward momentum wanes, the gap between the two moving averages narrows.
In other words, as price falls and MACD also falls, but if the price’s downward momentum weakens before it hits a bottom, MACD bottoms first.
MACD can sometimes lead price movements.
MACD can be used to measure the strength of a trend.
Like RSI and Stochastic, it is often classified as an oscillator, but unlike those two, in theory it can take any value (RSI and Stochastic range from 0% to 100%).
One note: MACD topping does not necessarily mean the price will top. It merely indicates that the upward momentum has weakened, and price can regain momentum and rise again.
The bottom works the same way.
We have learned that MACD can sometimes lead the price to a top or bottom.
However, tops and bottoms are things you recognize only in hindsight.
So, how should you measure MACD tops and bottoms?
By applying moving averages to the price chart, you can see the general trend. Then how should you view the MACD trend?
Just as you apply moving averages to the price chart, you should apply them to MACD as well.
This is what we call the “signal.”
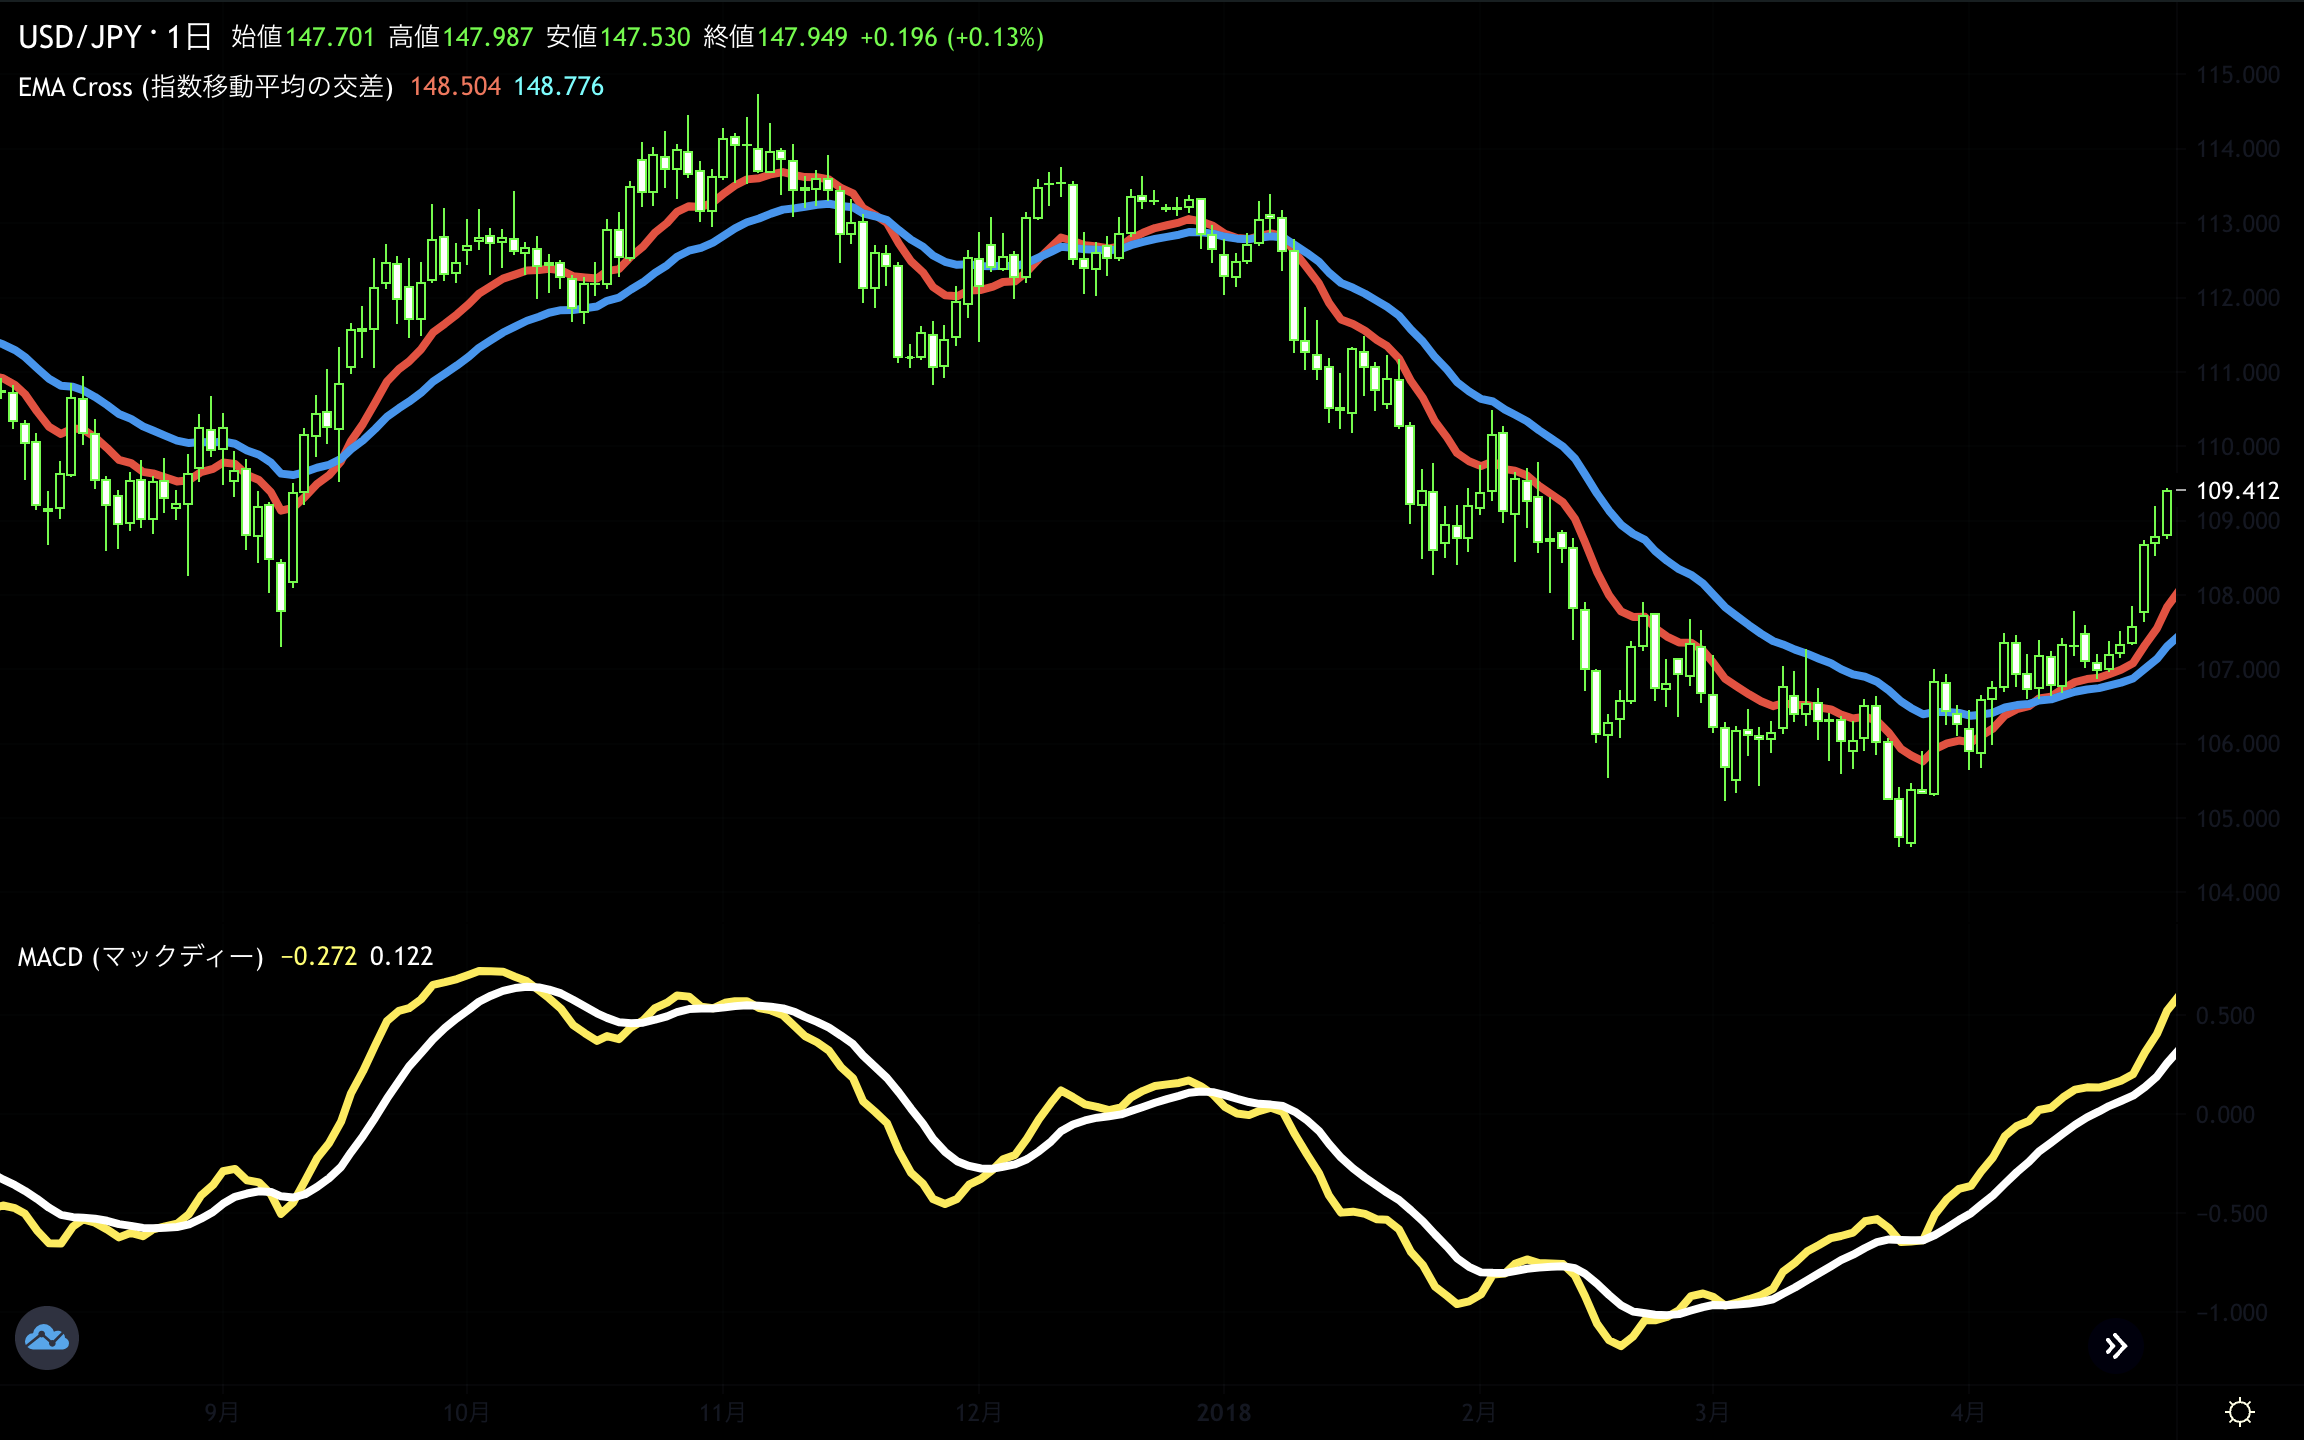
The white line is the signal
It’s a bit confusing to call it a signal when you already know it as such.
The standard is a 9-day moving average.
In the original meaning of MACD, since EMA is used in its definition, the standard for the signal is the 9-day EMA.
However, in MT4 and by default in FX brokers, a 9-day SMA is mostly used.
Not a huge difference, but understanding it and using it is very different from using it without knowing.
How to use it is the same as adding a moving average to the price chart.
When the MACD line and the signal cross in a golden cross, that is a sign that the MACD line may rise from here.
Meaning that if the MACD line rises and breaks above the 0 line, the gap between the two moving averages becomes zero, and a golden cross of the two EMAs on the price chart occurs.
In other words, if you can capture the rise of the MACD line, you can quickly catch the subsequent price rise.
One more caution: even if the MACD line and the signal cross in a golden cross, it does not guarantee the price will rise.
Finally, about the histogram.
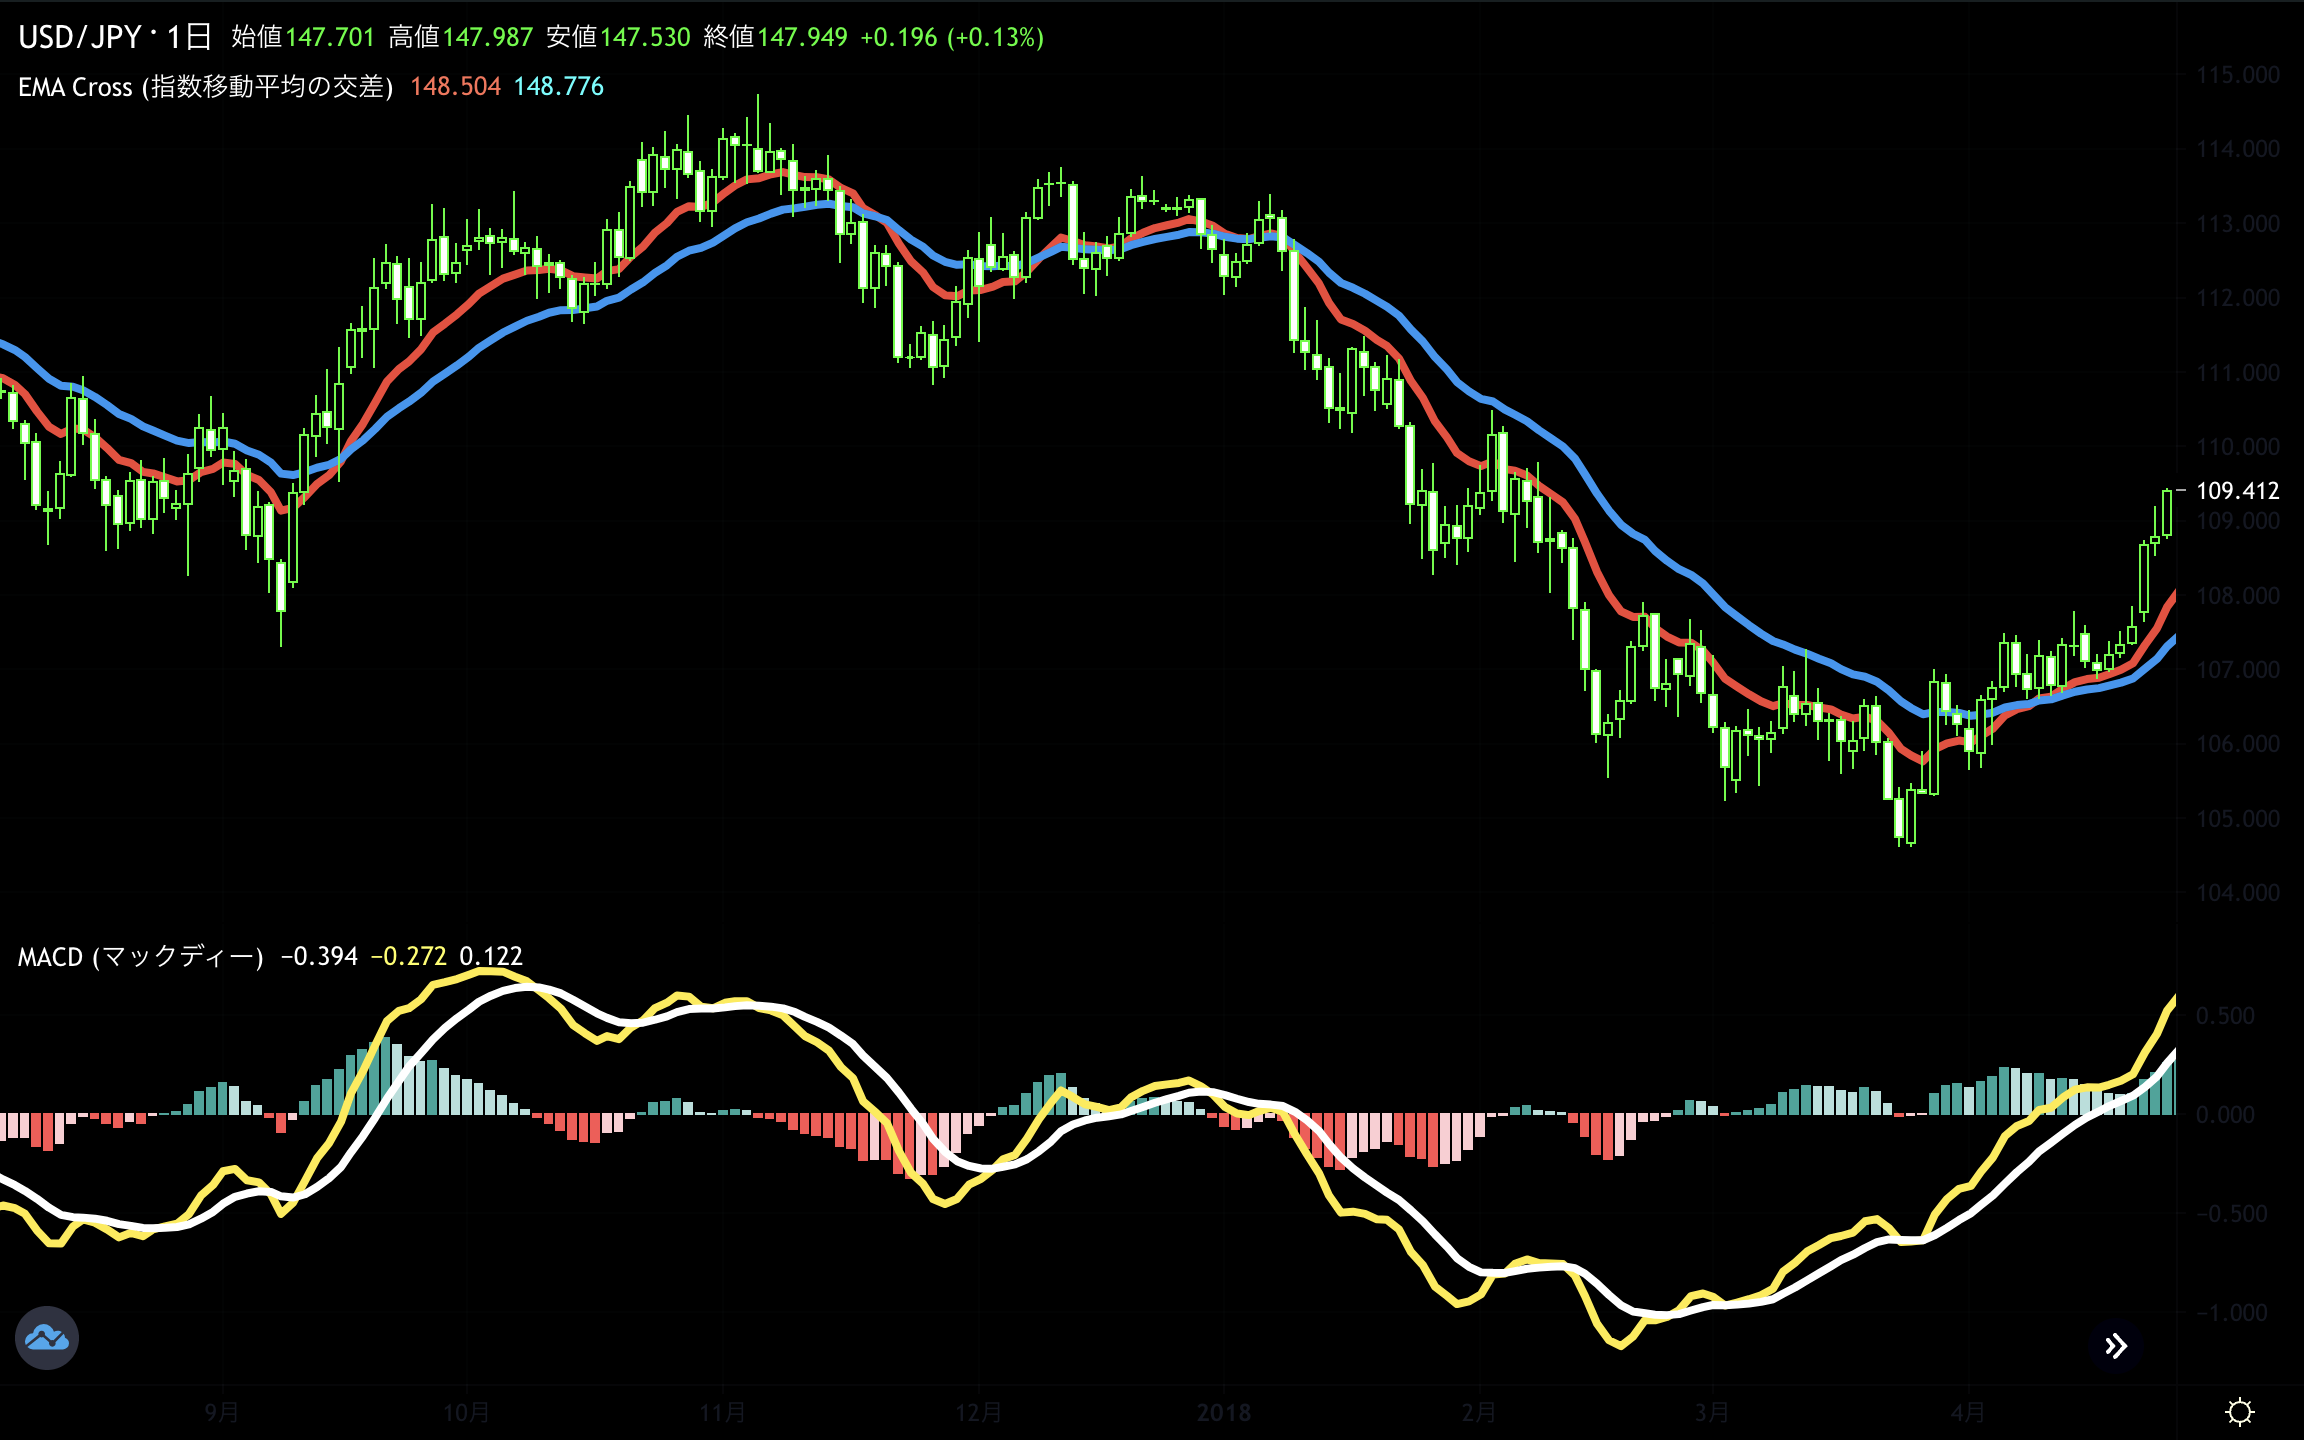
The vertical bars are the histogram
To seek tops and bottoms of price, MACD line shows the gap between the two moving averages
That is, by looking at how the gap between the MACD line and the signal line changes, you get the histogram.
If you’ve reached this point, you should have a good grasp of the MACD overall picture.
MACD definition
MACD line = short-term EMA − long-term EMA
Histogram = MACD line − signal
Signal = 9-day moving average
There is MACD to anticipate price movements, and there is the histogram to anticipate MACD movements.
Let’s look at this using TradingView or an FX broker’s chart system.
When analyzing MACD, use
Short-term EMA
Long-term EMA
MACD line
Signal
Histogram
Use these five lines for analysis.
One more note: MT4’s default setting displays MACD as a vertical bar chart, and the histogram is treated as a separate indicator called “Moving Average of Oscillator.”
Understanding the limitations of simple moving averages, understanding EMA, thinking about buy/sell signals, and grasping the essence of MACD will change how you view charts entirely.
The books and web explanations floating around are often incorrect. I hope through these articles I have conveyed useful points to readers.
For those who haven’t read them yet, please take a look at the previous articles as well.
Limitations of moving averages
Definition of EMA, do you know it?
Why is the golden cross a buy signal?
MACD is something that looks ahead at〇〇