
EUR/USD is in an "oversold" state. Upward signal (Point & Figure, Stochastics)
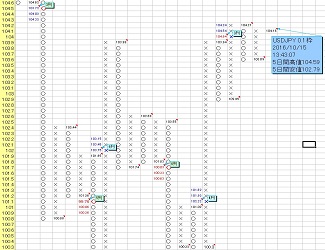
The previous article saidThe USD/JPY has reached the target zone without a sizable retracement“
Slow Stochastic
Blue line = %K, pink line = %D, yellow line = Slow %D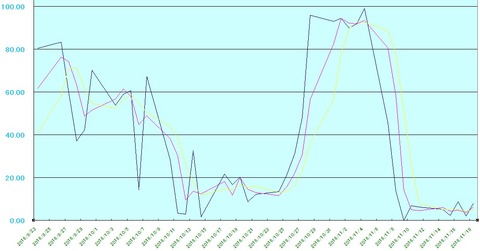
0.002 frame P&F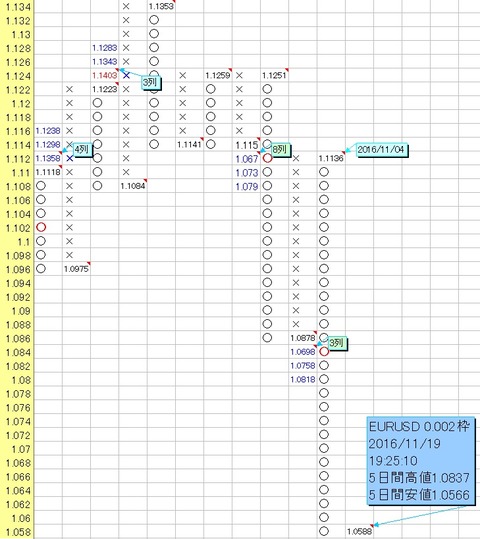
The EUR/USD continues to decline.
As shown above, it has broken through the 0.002 frame point & figure maximum downside target of 1.067 and continues to fall, indicating an oversold condition.
In the chart above, a bullish occurred, and a bullish signal was generated()。
The EUR/USD downtrend is likely to continue, but perhaps a rebound may come soon.
※ What is a divergence in Stochastics
When the price makes a new high or new low, but the Stochastics does not confirm with a new high or low, this is called a divergence in Stochastics.
A divergence in Stochastics is similarly a signal that suggests possible market turning points, like a MACD divergence.
Limited-time discount campaign notice
Introduction to the Points & Figures (Secret Chart)
For those who want to learn more about Points & Figures (Secret Chart)
× ![]()