

Using three moving averages

Order of lines
How many permutations are there for the order of three moving average lines?
What is a Perfect Order?
This is an overwhelmingly easier problem than the issues in the last three articles, haha.
Drawbacks of moving averages
Definition of EMA, do you know it?
Why is the Golden Cross a buy signal?
Answer
There are 6 orders for three lines.
From the top, short-term, medium-term, long-term or
From the bottom, short-term, medium-term, long-term is called the Perfect Order.
Explanation
The order of three moving average lines is a simple math problem, 3! = 3 × 2 × 1 = 6 ways.
Regarding the Perfect Order, it is defined not only for three lines but also for four or more lines, as a shape where the sequence runs from the short-term line to the long-term line in consecutive periods.
Here, we introduce a moving average large-cycle analysis that is easy to understand and use even for beginners.
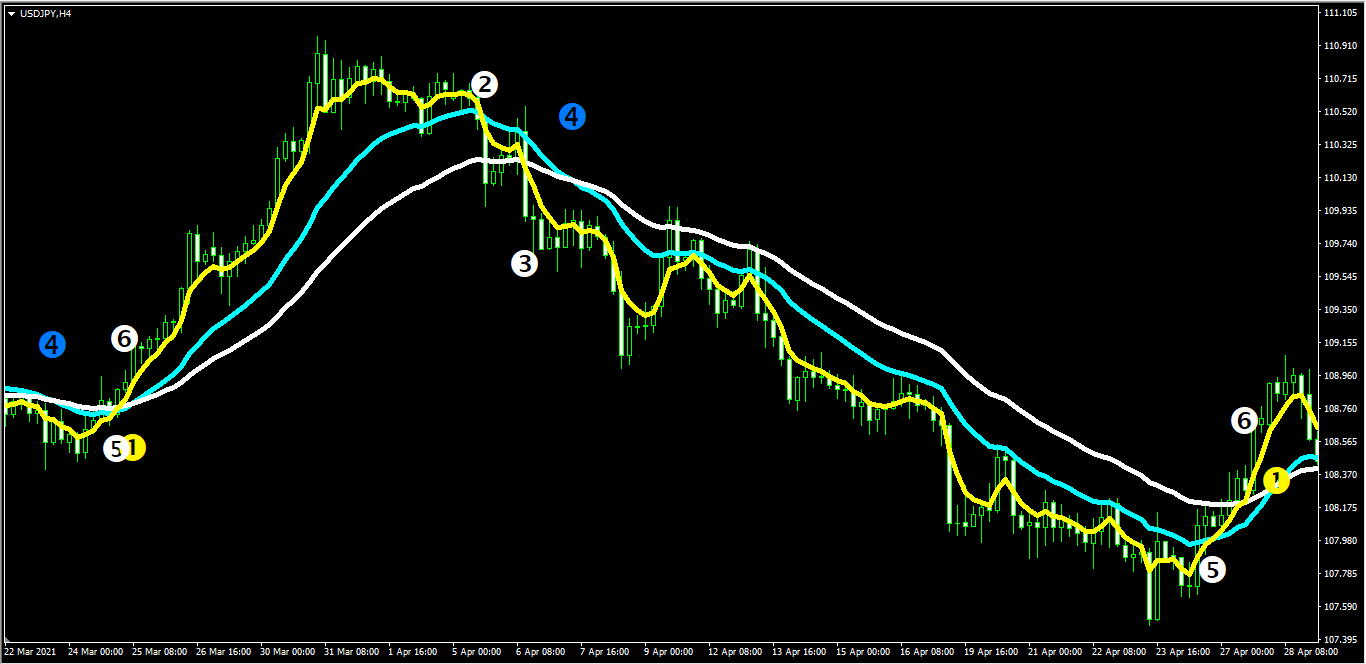
Moving Average Large-Cycle Analysis is a method that classifies market conditions into six categories based on the positional relationships of the three moving averages (short-term, medium-term, long-term) and analyzes them.
【Order of Moving Averages】 (from the top)
① Short-term → Middle-term → Long-term → Stage 1 (Stable Upward)
② Middle-term → Short-term → Long-term → Stage 2 (End of Uptrend)
③ Middle-term → Long-term → Short-term → Stage 3 (Starting Downtrend)
④ Long-term → Middle-term → Short-term → Stage 4 (Stable Downward)
⑤ Long-term → Short-term → Middle-term → Stage 5 (End of Downtrend)
⑥ Short-term → Long-term → Middle-term → Stage 6 (Start of Uptrend)
Using three moving averages has long existed as a method, but it is Yoshiji Kojiro-sensei who organized it systematically and called it Moving Average Large-Cycle Analysis.
There are many explanations about Moving Average Large-Cycle Analysis in Kojiro-sensei’s columns and videos, so please be sure to check those out!
This Investment Navi+ seems to prohibit embedding from external sites, so please search for “Moving Average Large-Cycle Analysis.”
My introduction to Kojiro-sensei came from this video on Torei.
[Foreseeing Nikkei 30,000] Beautiful Trader who earned 3,281 pips a year ascends! There is a love story〝【Torei BAR】
When I started FX in June 2023, and watched this video for the first time, I saw Moving Average Large-Cycle Analysis and thought, “This is what I’ve been seeking.”
Until then, I had been displaying Bollinger Bands, 75SMA, and 200SMA on charts and doing three-line usage, but I couldn’t establish solid trading rules and was just hoping to make money in FX. After learning about Kojiro-sensei, I watched his videos and columns obsessively.
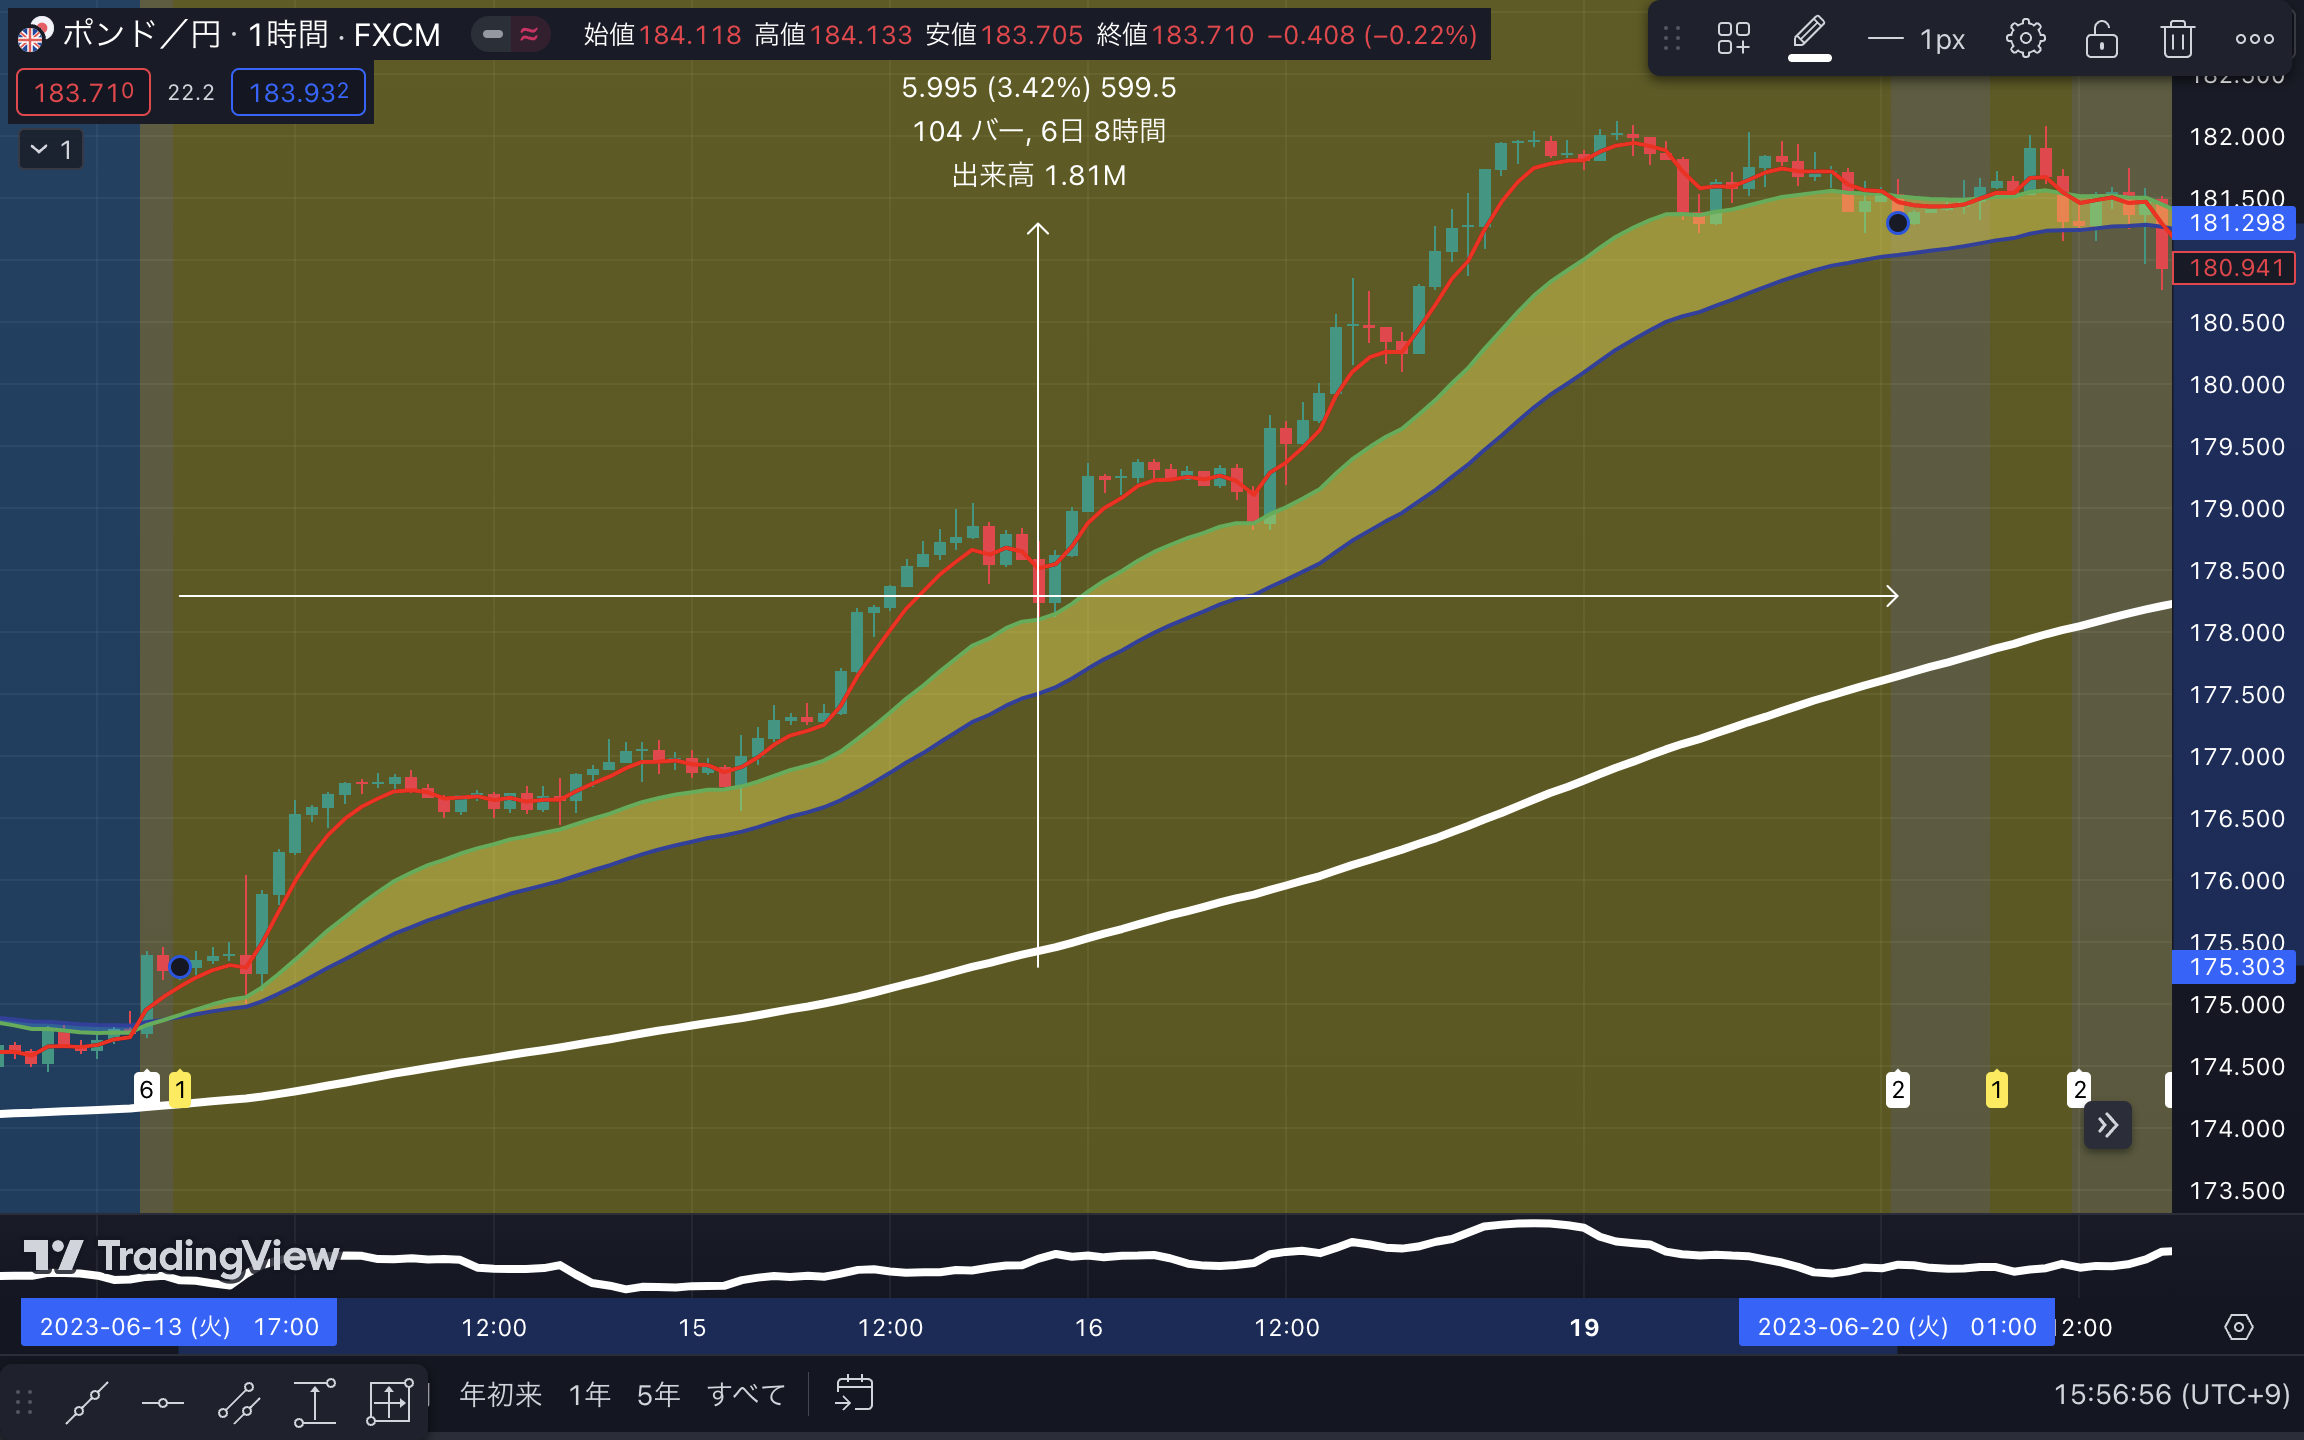
I clearly remember missing 600 pips in the GBP/JPY move in June 2023. The market went up without a pullback, and I could only watch with my fingers in my mouth. I did not short, so I did not incur losses.
I learned about Iida-dai after the move.
If I had known Iida-dai earlier, profits would have been easy to obtain. I wish I had known it sooner.
I also bought the books Traders’ Bible and Chart Analysis Encyclopedia.
In the past, the information from the books and investing influencers I relied on could not consistently win, but thanks to Kojiro-sensei, my trading skills improved dramatically.
After watching Kojiro-sensei’s technical analysis explanation videos and columns, I realized how crucial correct learning is.
↑ My self-made MT4 Iida Sign Tool


I will backtest on your behalf “Backtest of trading rules for the past 20 years”
↑ This shows an example of backtesting trading rules using Moving Average Large-Cycle Analysis. Please have a look!