

Profit & Figure Chart Profit Target Count Model Site
Hello.
FX Research, Satori here.
Today, we bring you the “Counting model site for profit targets on Points & Figure charts.”
The diagram below shows the counting method published on the model site for calculating profit targets on Points & Figure charts.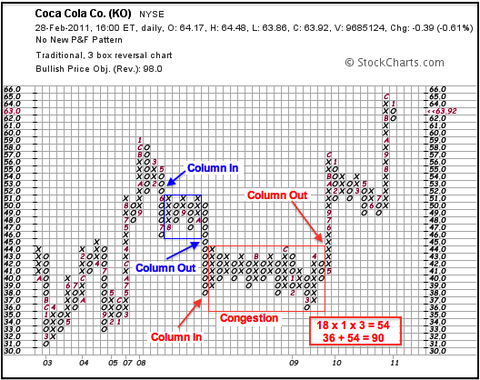
http://livedoor.blogimg.jp/fxmt4indicator/imgs/3/9/39e7483f.png
Quoted from stockcharts . com site
https://stockcharts.com/school/doku.php?id=chart_school:chart_analysis:pnf_charts:pnf_horizontal_count
On the site above, in the calculation method for profit targets at a breakout from a consolidation,
the count is performed on both sides of the consolidation, and the reference price is the high and low of the consolidation excluding both sides.
If you read the diagram above accurately, for selling you use the upper price of the consolidation, and for buying you use the price one tick above the lower bound of the consolidation.
Perhaps to maintain consistency between selling and buying.
I have published horizontal counts on my blog and site, but since Points & Figure charts originated in the United States, please confirm the counting method on the sites above for accuracy.
I will continue to make corrections in the future.
The indicators related to today's article are as follows.


