

【BTCJPY】20180830 Daily Pivot
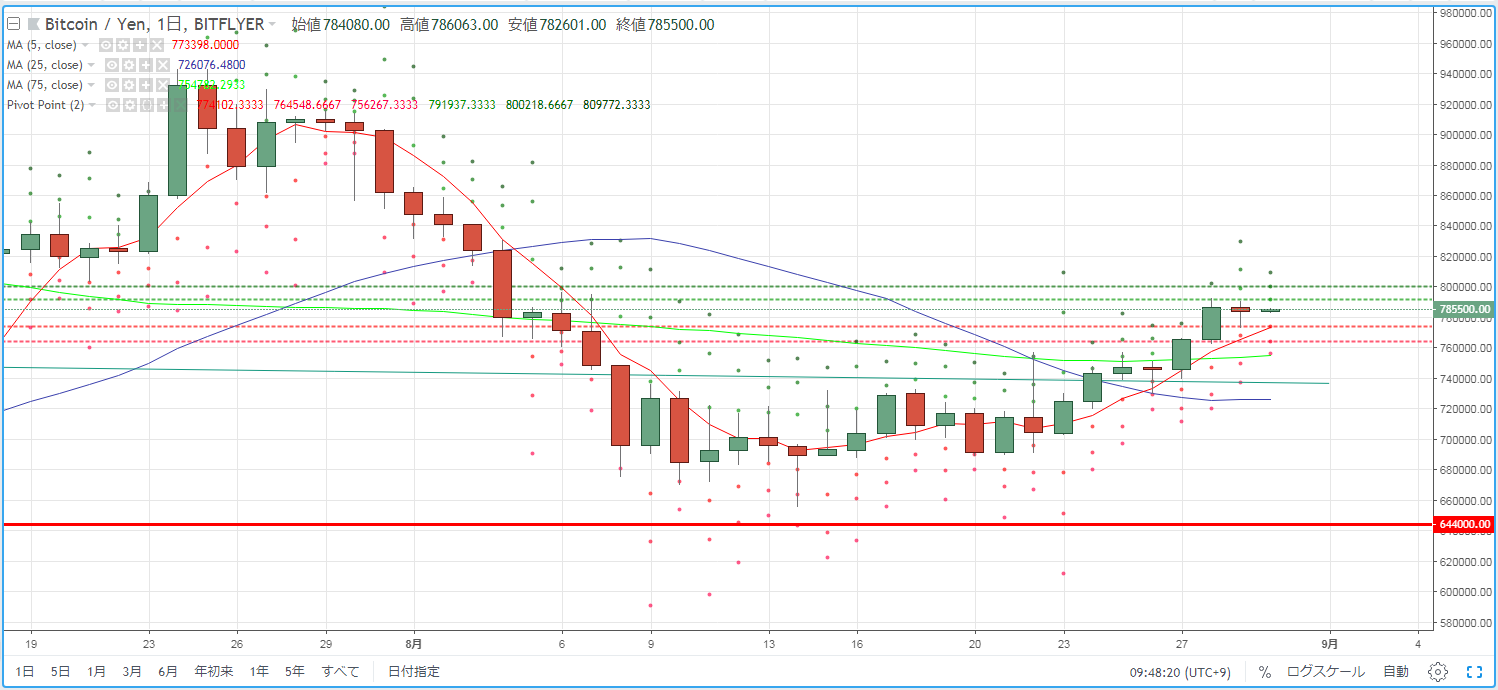
As a guideline for day trading BTCJPY, we check the Pivot. Yesterday (August 29) the rally that had continued since the 27th paused. The market environment lacked direction and showed low volatility.
R2=800,218
R1=791,937
S1=774,102
S2=764,548
※ A pivot is a technical indicator that predicts the price movement range for the day based on the previous day's price action. Centered on the Pivot Point (PP), draw resistance lines (R1, R2) above and below and support lines (S1, S2) to use them as trading guidelines.
【Calculation Formula】
Pivot Point (PP) = (previous day's close + high + low) / 3
Resistance Line 1 (R1) = PP + (PP - previous day's low)
Support Line 1 (S1) = PP - (previous day's high - PP)
Resistance Line 2 (R2) = PP + (previous day's high - previous day's low)
Support Line 2 (S2) = PP - (previous day's high - previous day's low)


