
A Comprehensive Reveal of the RSI Bollinger Method Various Aspects
This is the Reiwa era Double-E content from the EA developer.
This time“A comprehensive reveal of RSI Bollinger methods!!”
So,
I will mainly reveal the methods I usually use in discretionary trading.
I think it’s interesting to see the methods that an EA developer uses in discretionary trading.
Also,
this method
Reiwa’s Double-E “Push-Back Buy / Pullback Sell Logic” now publicly available!!
In combination with this, I am performing discretionary trading, so I think you’ll benefit from reading both.
【What is RSI Bollinger?】
First, I will explain what RSI Bollinger actually is.
I think it’s easier to understand with images.
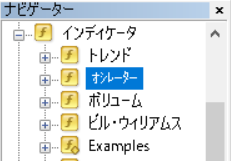
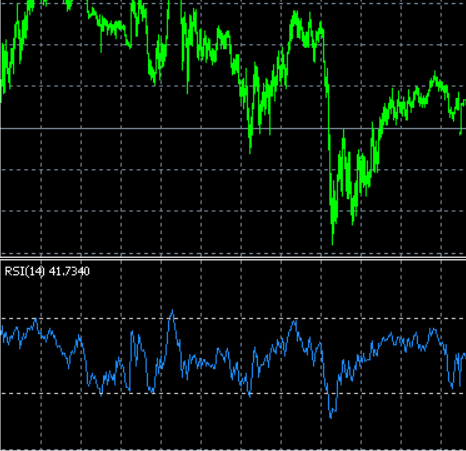
First, select and display RSI.
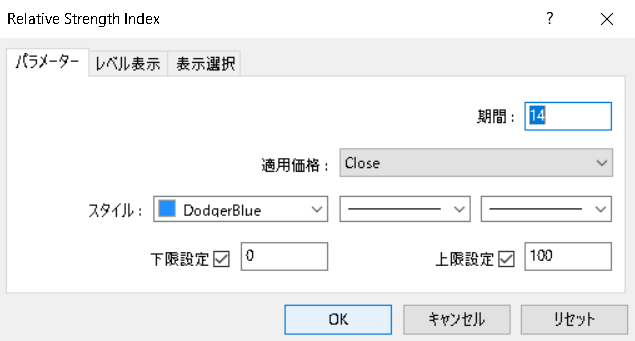
The parameters can remain the same with a period of 14.
Now, here is an operation that many people may not know!
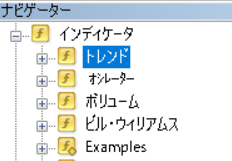
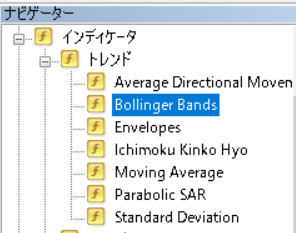
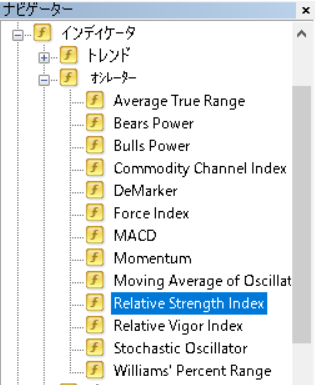
Choose Bollinger Bands,
and attach this Bollinger Band to the RSI in the lower window.
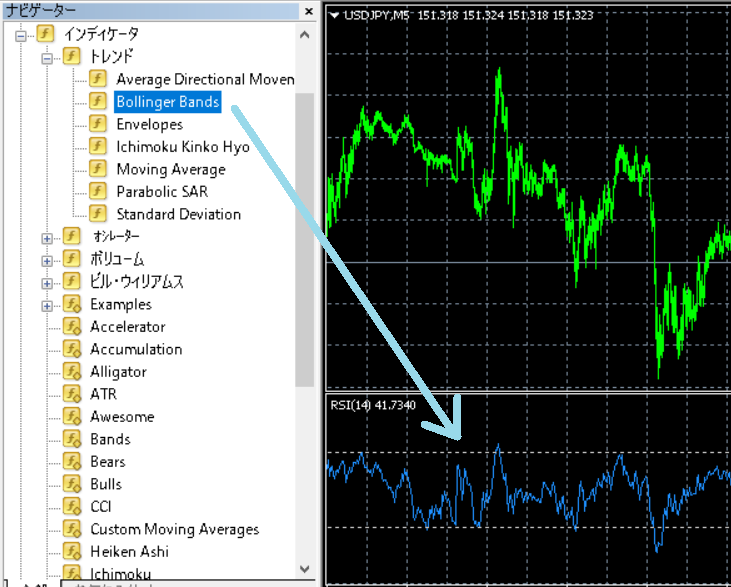
What to do is,
“Hold down the left mouse button on Bollinger Bands” and “drag it to RSI.”
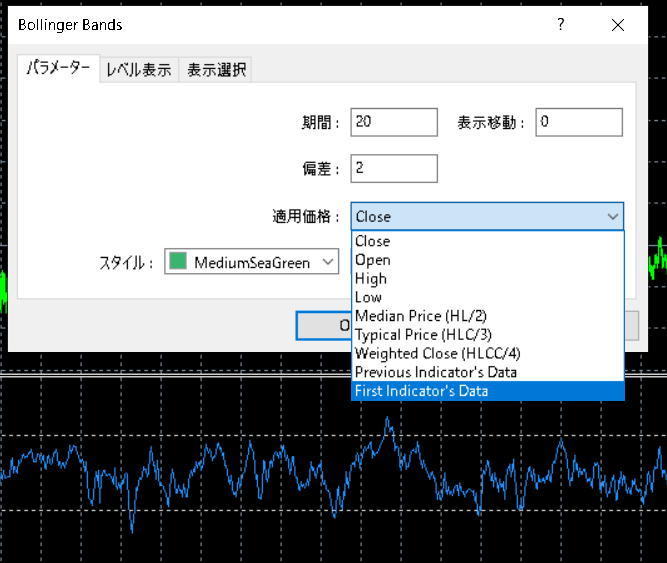
Then, when the Bollinger Bands dialog opens,
select “First Indicator's Data” for the Apply Price.
Then...
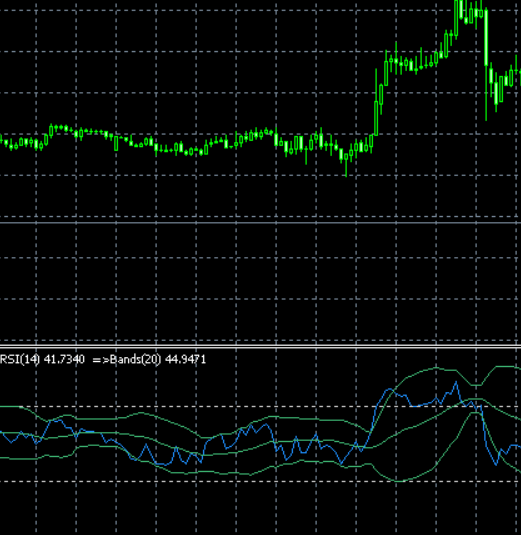
This will draw Bollinger Bands based on RSI values like this!!
※ This can be applied not only to RSI but to various indicators.
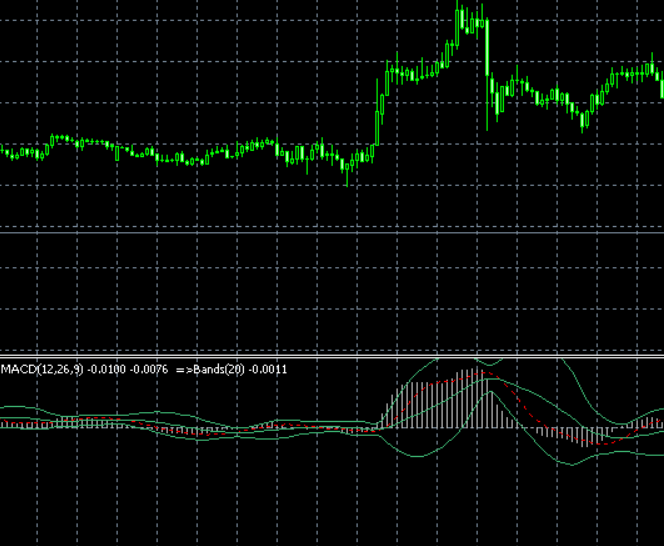
▲ MACD Bollinger
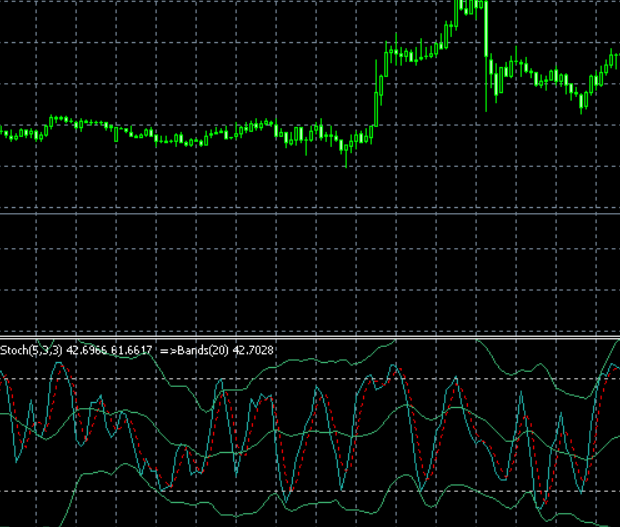
▲ Stochastic Bollinger
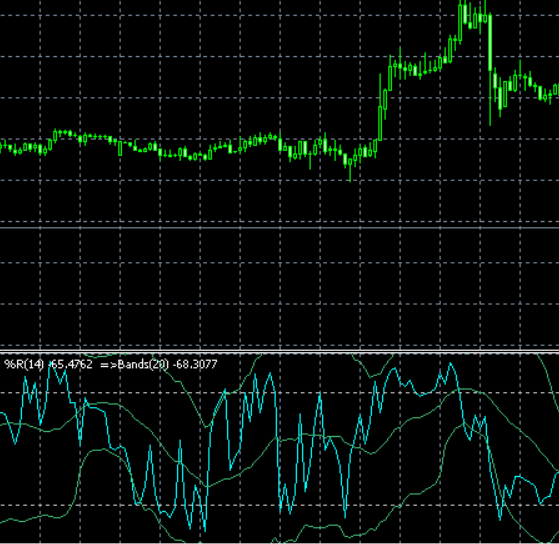
▲ WPR Bollinger
and more,
you can overlay Bollinger Bands on various lower indicators like this.
How about that? Interesting, isn’t it?
Based on this, there may be times when a new method comes to mind.
With that in mind!!
What I am currently using in discretionary trading?
I will reveal that in detail from here on!!
Originally,
I thought it would be free of charge,
but I think EA developers who see this
could easily convert this into an EA, and
there is a high possibility that it could be profitable as discretionary trading as well,
so,
I apologize, but
from here on out,
the content will be paid.
Thank you very much for your understanding.