
From the latest USD/JPY chart: a downward channel and a pullback buy signal using mBDSR (RCI two-band filter)
Indicator that shines when combined with RCI: BODSOR and mBDSR
Method and Case Studies (PDF) ★GogoJungle AWARD 2020 Winner★
https://www.gogojungle.co.jp/tools/indicators/11836
The PDF files are 283 in total.
Many of them consist of examples that deduce a process where upper and lower timeframes are logically linked using three RCI lines, and finally wait for the timing to buy on a pullback in the lower timeframe or sell on a retrace (the mBDSR signal).tobecome.
Also,many focus on identifying points where multiple entry reasons overlap.There are many such cases.
The explanations useover 1,000 charts in total..

In recent Investor Navi+ articles,you will see examples that highlight the strong compatibility between various trading methods and the mBDSR signal.
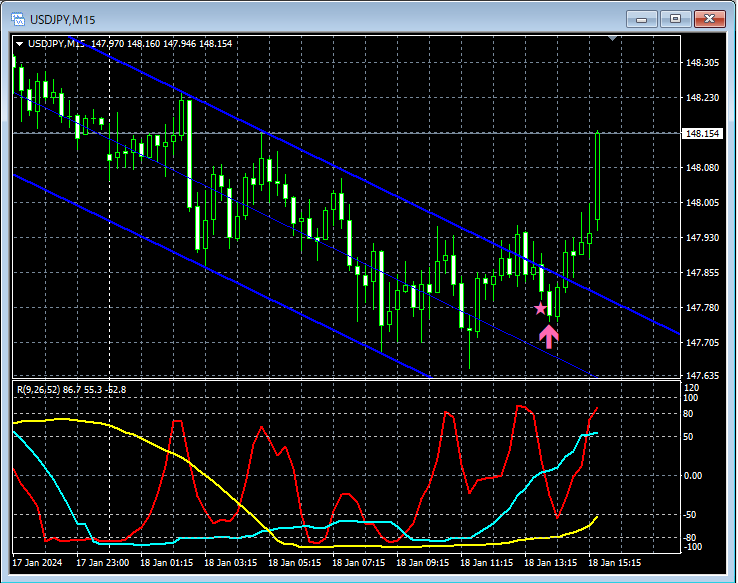
Dollar/Yen 15-minute chart
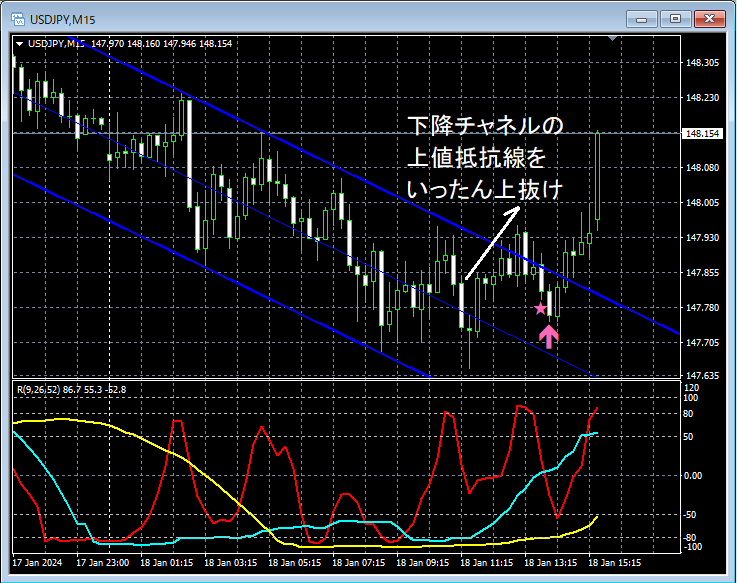
On the 15-minute chart above,price moved above the downward channel's upper resistance linefor a moment. When it then moved down,the mBDSR pullback-buy signal (filter: RCI26 and RCI52)lit up, and price subsequently rose.
From this example,the high compatibility between a trend-trading method focused on the descending channelandthe mBDSR signalis evident.
Indicator that shines when combined with RCI: BODSOR and mBDSR
Method and Case Studies (PDF) ★GogoJungle AWARD 2020 Winner★
https://www.gogojungle.co.jp/tools/indicators/11836
The PDF files are 283 in total.
Many of them consist of examples that deduce a process where upper and lower timeframes are logically linked using three RCI lines, and finally wait for the timing to buy on a pullback in the lower timeframe or sell on a retrace (the mBDSR signal).to become.
Also,many focus on identifying points where multiple entry reasons overlap.There are many such cases.
The explanations useover 1,000 charts in total..
