

【BTCJPY】20180826 Daily Pivot
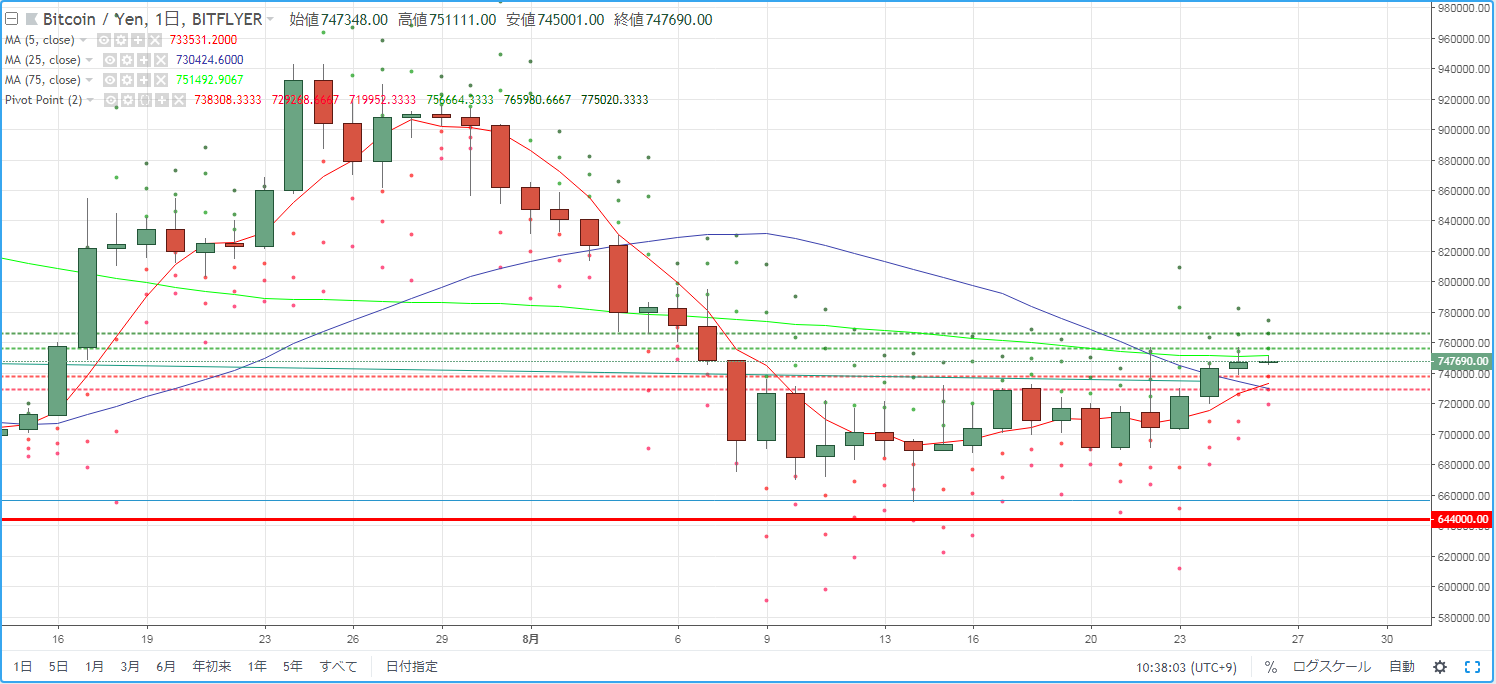
As a guideline for day trading BTCJPY, we verify the pivot. It breaks above the neck line of the previous inverted head and shoulders, forming a bullish candle. However, the price movement is not wide, and it remains a minor range.
R2=765,980
R1=756,664
S1=738,308
S2=729,268
※ A pivot is a technical indicator that predicts today's price movement from yesterday's price action. Centered on the pivot point (PP), draw resistance lines (R1, R2) and support lines (S1, S2) above and below, and use them as trading references.
【Calculation Formula】
Pivot Point (PP) = (Yesterday's close + Yesterday's high + Yesterday's low) / 3
Resistance Line 1 (R1) = PP + (PP - Yesterday's low)
Support Line 1 (S1) = PP - (Yesterday's high - PP)
Resistance Line 2 (R2) = PP + (Yesterday's high - Yesterday's low)
Support Line 2 (S2) = PP - (Yesterday's high - Yesterday's low)


