
Pound/Yen: bullish flag and R1 R2 S2 pullback buying signal
Indicator that shows its power when combined with RCI【BODSOR・mBDSR】
and methods and case studies (PDF) ★GogoJungle AWARD2020 winner★
https://www.gogojungle.co.jp/tools/indicators/11836
A PDF file with 283 attachments is included.
Many of them are cases that have been distilled into a form where you logically link higher timeframes and lower timeframes using three RCI lines, sequentially considering the状況 of multiple lower timeframes, and ultimately waiting for a pullback buy or pullback sell timing on the lower timeframe (i.e., the mBDSR signal)..
Also,many focus on capturing points where multiple entry reasons coincide.There are many of those as well.
In the explanations,more than 1,000 charts

※【R1R2S2】is included in the above product.
※【R1R2S2】for detailed explanationshere.
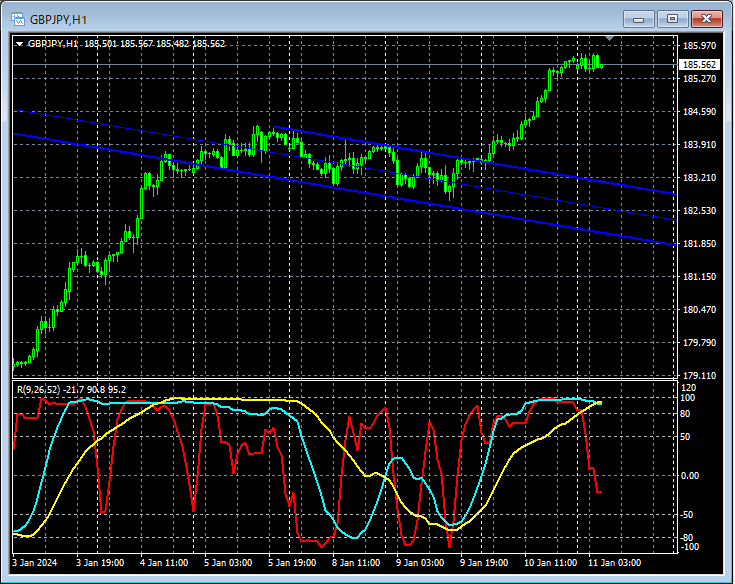
GBP/JPY 1-hour
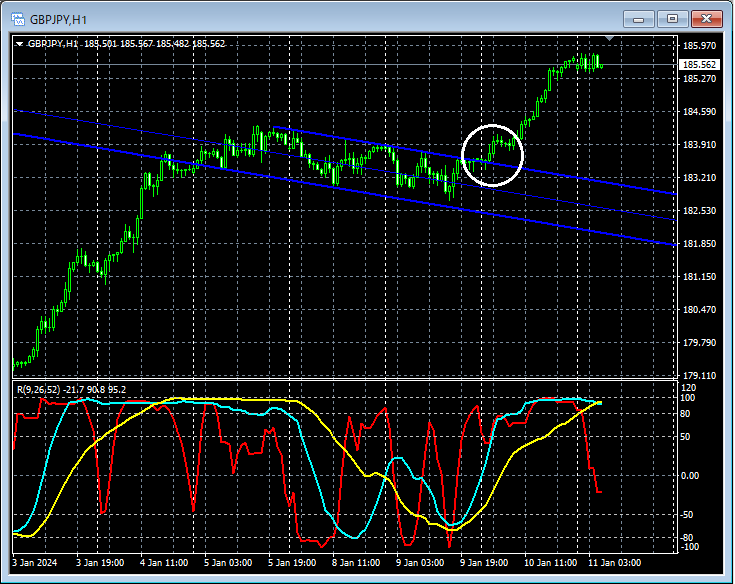
If you look at the area encircled in white on the 1-hour chart above,the price has broken above the resistance line of the rising flag,so it may be a scene where an upward move could occur.
GBP/JPY 30-minute
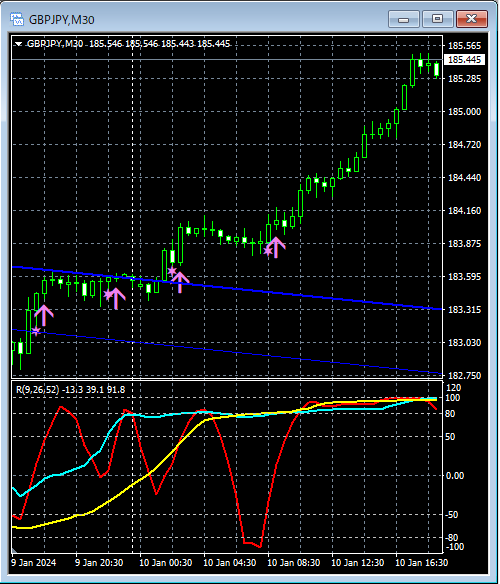
On the 30-minute chart above,the rising flaghas several instances of the R1R2S2 pullback buy signal near the resistance breakoutas seenafter breaking above the resistance line of the rising flagthe R1R2S2 pullback buy signal
From this example,it shows the high compatibility between a trading method focused on the rising flag andthe signal ofR1R2S2.
Indicator that shows its power when combined with RCI【BODSOR・mBDSR】
and methods and case studies (PDF) ★GogoJungle AWARD2020 winner★
https://www.gogojungle.co.jp/tools/indicators/11836
A PDF file with 283 attachments is included.
Many of them are cases that have been distilled into a form where you logically link higher timeframes and lower timeframes using three RCI lines, sequentially considering the状況 of multiple lower timeframes, and ultimately waiting for a pullback buy or pullback sell timing on the lower timeframe (i.e., the mBDSR signal)..
Also,many focus on capturing points where multiple entry reasons coincide.There are many of those as well.
In the explanations,more than 1,000 chartsare used.
