

【BTCJPY】20180822 Daily Pivot
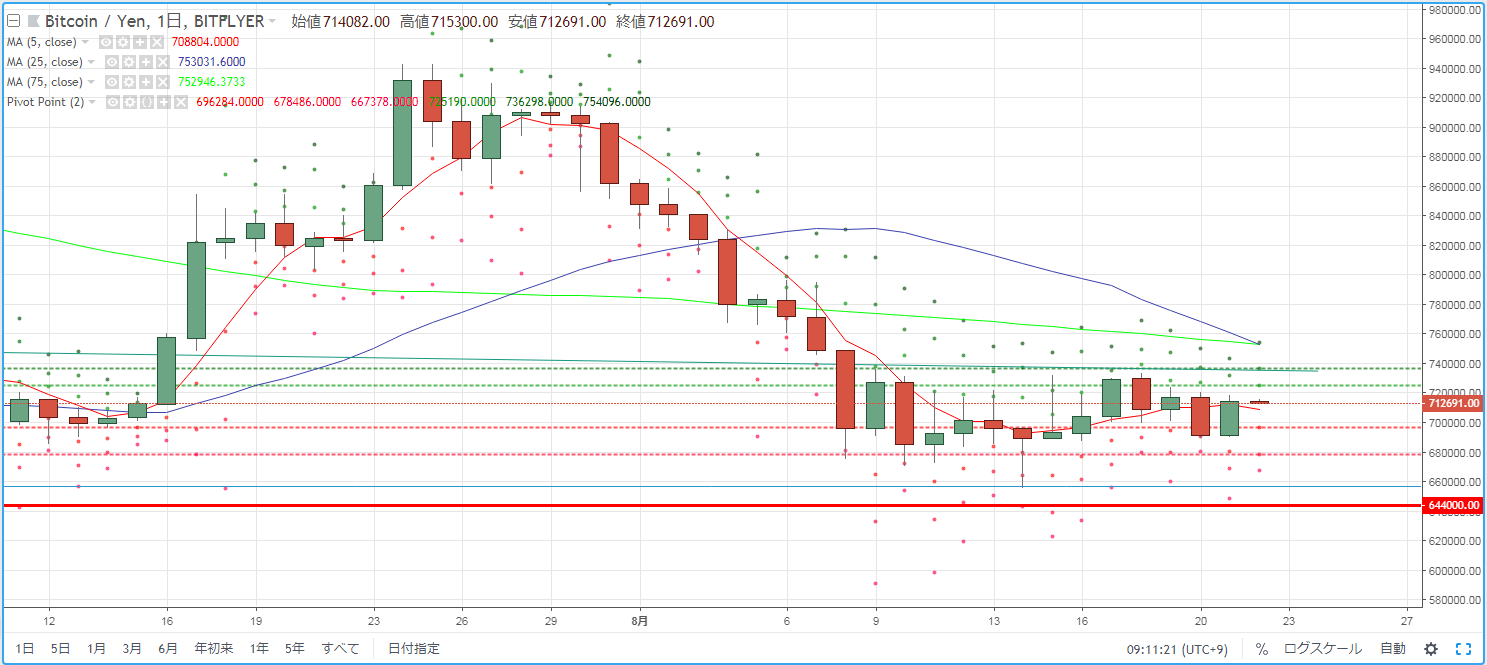
As a guideline for day trading BTCJPY, we check pivots. Yesterday (August 21) formed a bullish candle that essentially recovered most of the decline from the day before, and once again closed above the 5MA in the market environment.
R2=736,298
R1=725,190
S1=696,284
S2=678,486
※ A pivot is a technical indicator that predicts the day's price movement based on the previous day's price action. Centered on the Pivot Point (PP), draw resistance lines (R1, R2) above and below, and support lines (S1, S2) below, and use them as trading references.
【Calculation formula】
Pivot Point (PP) = (Previous day's close + previous day's high + previous day's low) / 3
Resistance Line 1 (R1) = PP + (PP - previous day's low)
Support Line 1 (S1) = PP - (previous day's high - PP)
Resistance Line 2 (R2) = PP + (previous day's high - previous day's low)
Support Line 2 (S2) = PP - (previous day's high - previous day's low)


