The Way of Investment (100) 【No. 100 Commemoration】


If trading on the daily chart
1.
Year-end Special Edition
If trading on the daily chart…
This year again with the year-end classic “If ... then” for the 100th anniversary!100th Anniversary
This year, using the daily chart, we will assume holding a position in only one direction (buy or sell) each month.
JanuaryAUDUSDBuy
FebruaryUSDJPYBuy
MarchGBPAUDBuy
AprilCHFJPYBuy
May, JuneCADJPYBuy
JulyUSDCHFSell
AugustNZDUSDSell
SeptemberNZDCHFBuy
October月11月AUDCADBuy
December月EURJPYSell
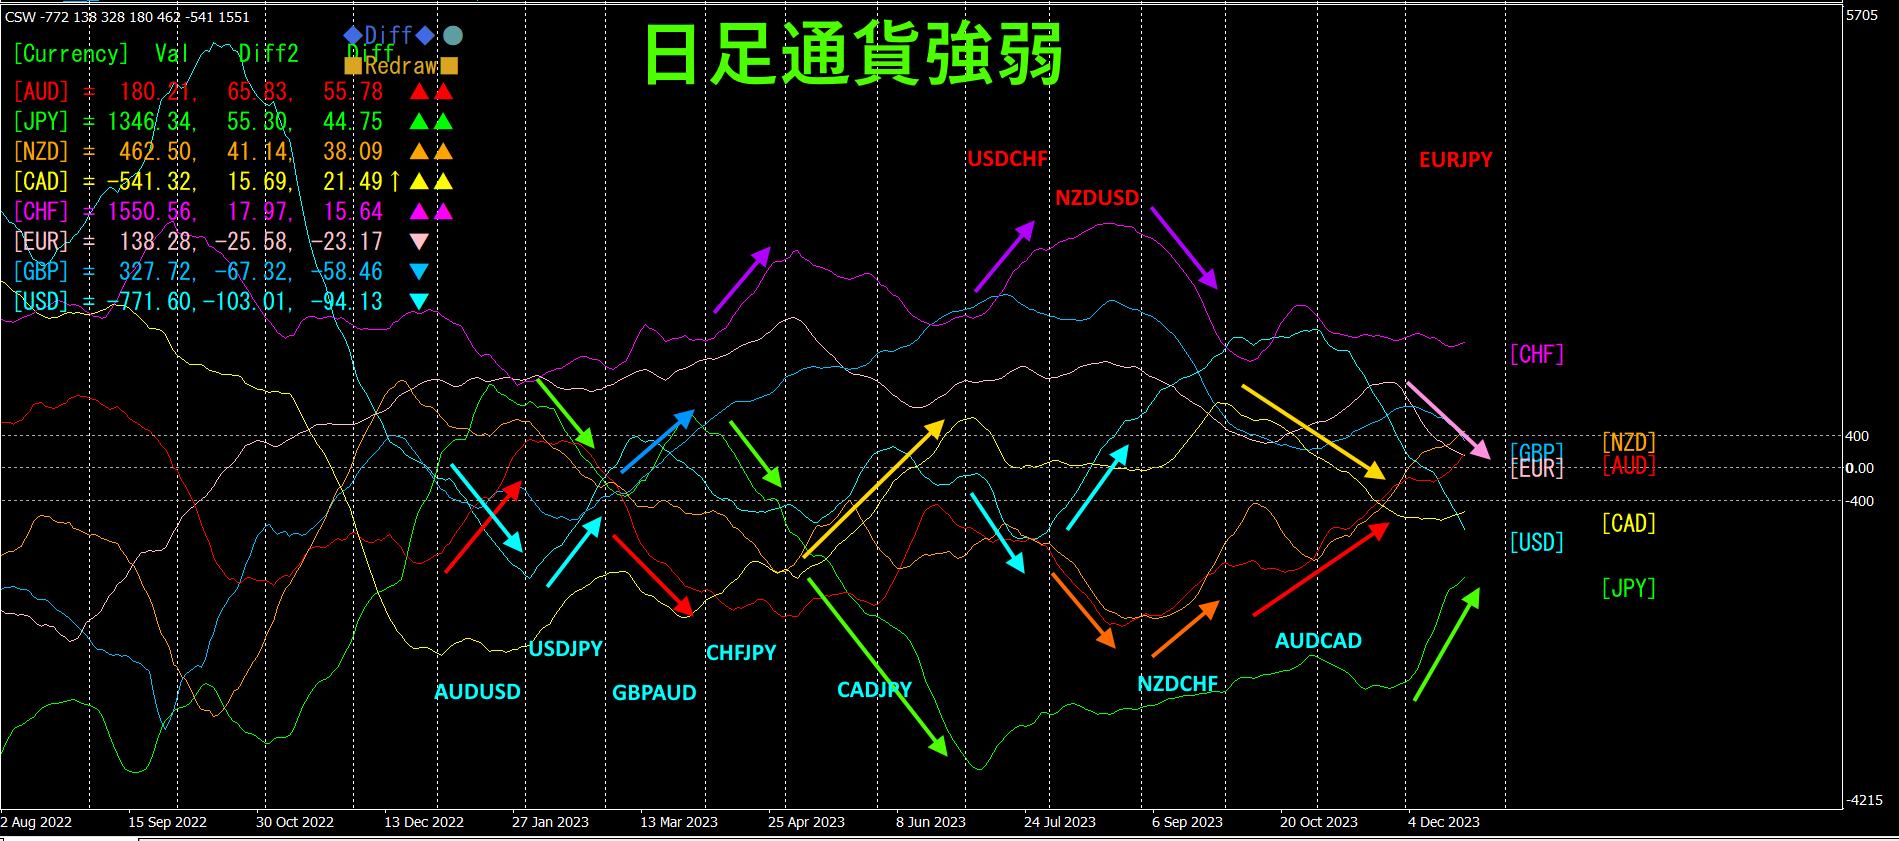
In the currency pair display, light blue indicates buy, red indicates sell.
The color of the arrows is shown in the color of each currency.
Now, what would be the total annual pips gained?
Currency Pair Entry Exitpips
JanuaryAUDUSD 0.67962 0.70531 256.9
FebruaryUSDJPY 128.903 136.176 727.3
MarchGBPAUD 1.77721 1.84414 669.3
AprilCHFJPY 145.064 152.280 721.6
May, JuneCADJPY 101.501 108.845 734.4
JulyUSDCHF 0.89602 0.87172 243.1
AugustNZDUSD 0.61475 0.59652 182.3
SeptemberNZDCHF 0.52582 0.54817 223.5
October月11月AUDCAD 0.87002 0.89906 290.4
December月EURJPY 159.713 154.823 489.0
Total4537.8pips
The above is calculated from the daily closing Bid, so Spread is not accounted for. Even so, by selecting one currency pair each month from the daily currency strength chart,annual4500pips of profit could be obtained.
The above results are after-the-fact analysis of the daily chart and extracting numbers. In actual live trading, you trade without seeing the future on the right side of the chart, so the real results would naturally differ from the above.
However,daily trading using currency strength chartsbased on the daily chart can still yield substantial profits, as has been demonstrated.