

【BTCJPY】20180820 Daily Pivot
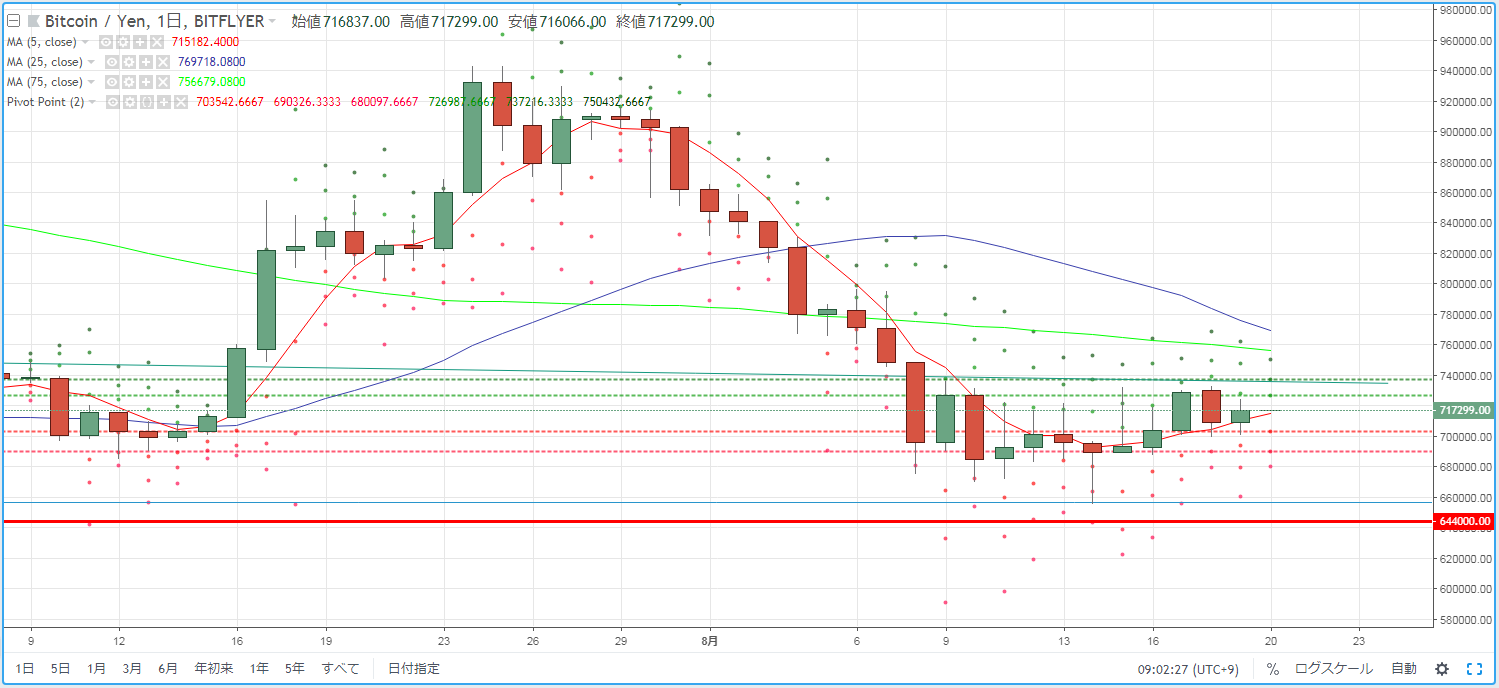
As a guideline for day trading BTCJPY, we confirm the pivot. Yesterday (August 19) formed a bullish candle, but it did not move much in price, and the market environment traded above the 5MA.
R2=737,216
R1=726,987
S1=703,542
S2=690,326
※ A pivot is a technical indicator that predicts the price range for the day based on the previous day's movement. Centered on the Pivot Point (PP), draw resistance lines (R1, R2) above and below, and support lines (S1, S2) below, using them as trading references.
【Calculation】
Pivot Point (PP) = (Previous day’s close + previous day’s high + previous day’s low) / 3
Resistance Line 1 (R1) = PP + (PP - previous day’s low)
Support Line 1 (S1) = PP - (previous day’s high - PP)
Resistance Line 2 (R2) = PP + (previous day’s high - previous day’s low)
Support Line 2 (S2) = PP - (previous day’s high - previous day’s low)


