

【BTCJPY】20180817 Daily Pivot
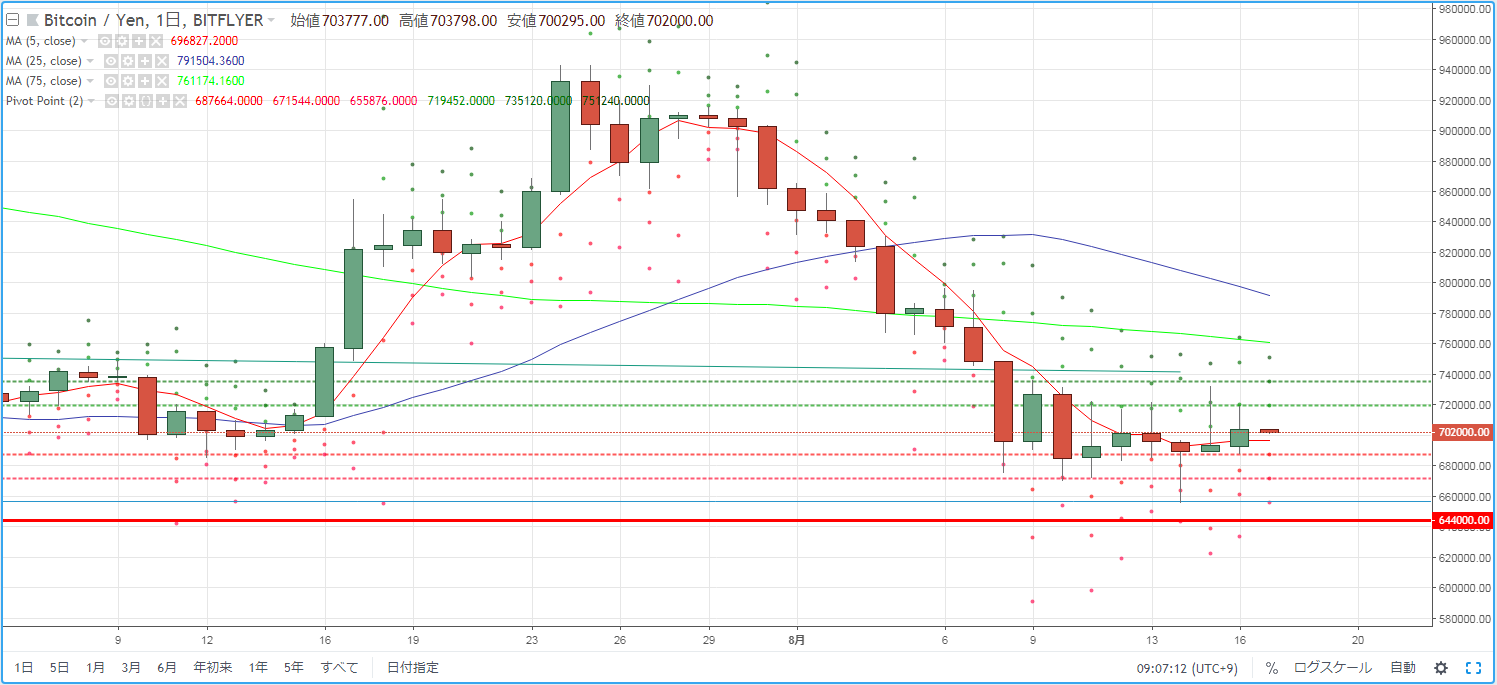
As a guideline for day trading BTCJPY, we check the pivot. Yesterday (August 16) the market environment closed above the 5MA, even though the gains were modest.
R2=735,120
R1=719,452
S1=687,664
S2=671,544
※ A pivot is a technical indicator that predicts the price movement for the day based on the previous day's price action. Centered on the Pivot Point (PP), draw resistance lines (R1, R2) and support lines (S1, S2) above and below, and use them as trading guides.
【Calculation Formula】
Pivot Point (PP) = (Previous Day's Close + Previous Day's High + Previous Day's Low) / 3
Resistance Line 1 (R1) = PP + (PP - Previous Day's Low)
Support Line 1 (S1) = PP - (Previous Day's High - PP)
Resistance Line 2 (R2) = PP + (Previous Day's High - Previous Day's Low)
Support Line 2 (S2) = PP - (Previous Day's High - Previous Day's Low)


