

【BTCJPY】20180816 Daily Pivot
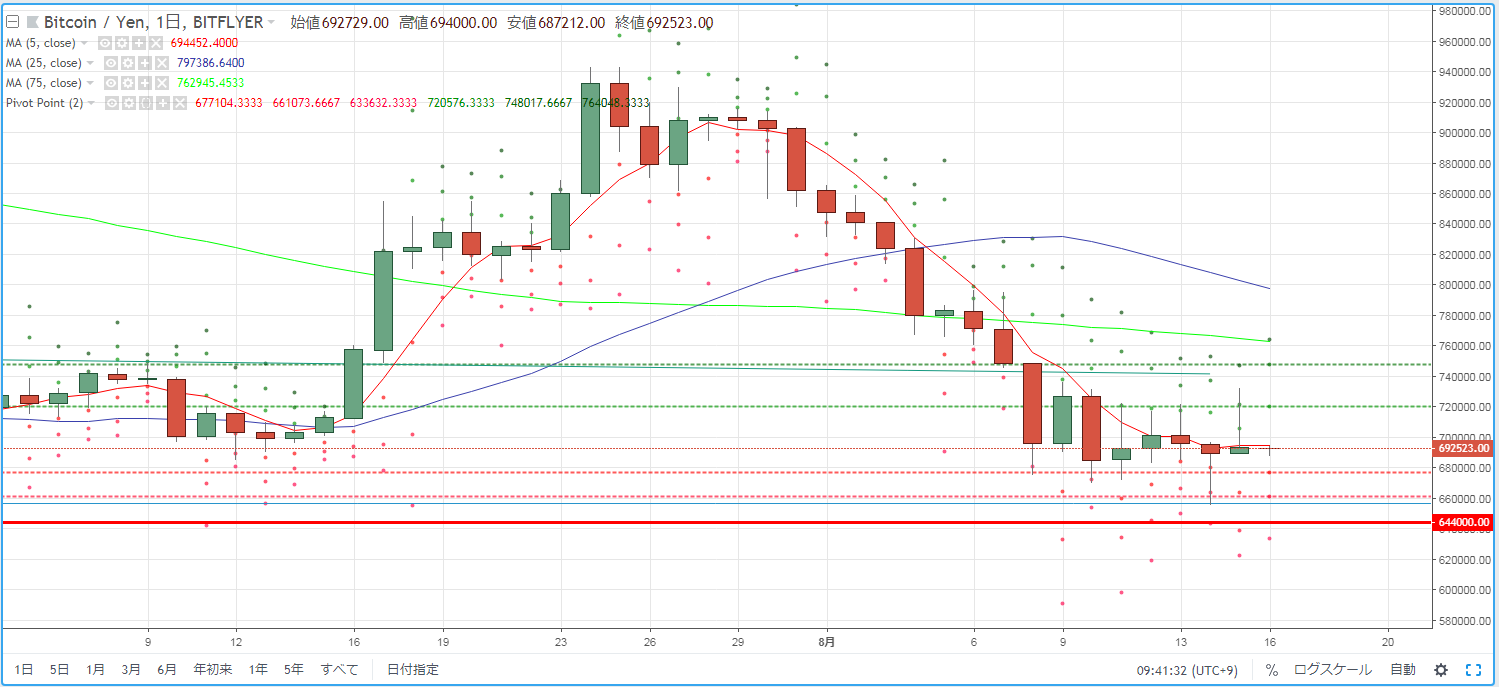
As a guideline for day trading BTCJPY, we check the pivot. Yesterday (August 15) formed a bullish candle with a long upper shadow and a short body, resembling a reversal of the candle from the day before, indicating a market environment that suggested a comeback by the selling force.
R2=748,017
R1=720,576
S1=677,104
S2=661,073
※ A pivot is a technical indicator that forecasts the trading range for the current day based on the previous day's price movement. Centered on the Pivot Point (PP), draw resistance lines (R1, R2) and support lines (S1, S2) above and below, and use them as trading references.
【Calculation formula】
Pivot Point (PP) = (Previous Day Close + Previous Day High + Previous Day Low) / 3
Resistance Line 1 (R1) = PP + (PP - Previous Day Low)
Support Line 1 (S1) = PP - (Previous Day High - PP)
Resistance Line 2 (R2) = PP + (Previous Day High - Previous Day Low)
Support Line 2 (S2) = PP - (Previous Day High - Previous Day Low)


