

【BTCJPY】20180814 Daily Pivot
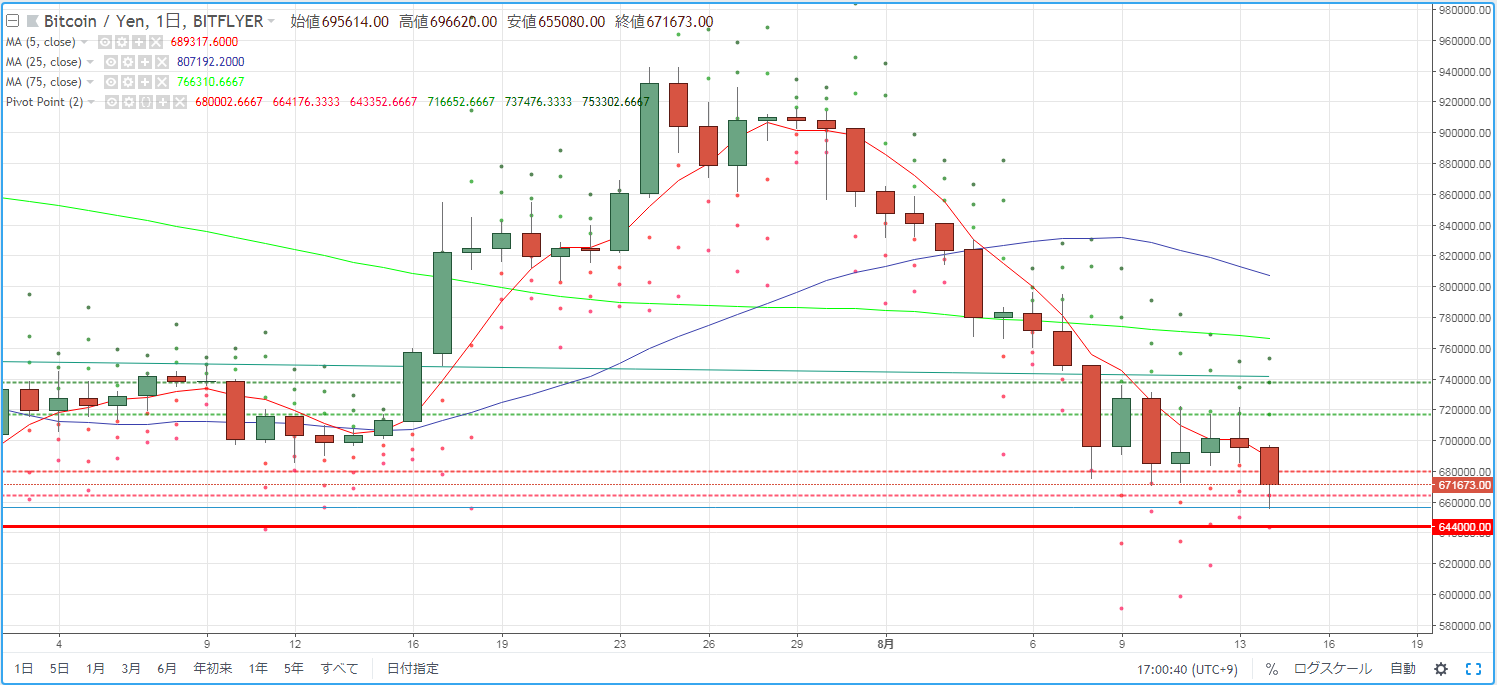
Using BTCJPY for day trading as a guideline, we check the pivot. Yesterday, although a bearish candle formed, prices did not make a new low and stayed in a small size. However, today the downtrend accelerated and it moved to quickly surpass the most recent lows.
R2=737,476
R1=716,652
S1=680,002
S2=664,176
※ A pivot is a technical indicator that predicts the range of price movement for the day based on the previous day's activity. With the Pivot Point (PP) at the center, resistance lines (R1, R2) above and support lines (S1, S2) below are drawn, and these are used as trading guidelines.
【Calculation Formula】
Pivot Point (PP) = (Previous day's close + previous day's high + previous day's low) / 3
Resistance Line 1 (R1) = PP + (PP - previous day's low)
Support Line 1 (S1) = PP - (previous day's high - PP)
Resistance Line 2 (R2) = PP + (previous day's high - previous day's low)
Support Line 2 (S2) = PP - (previous day's high - previous day's low)


