

【BTCJPY】20180813 Daily Pivot
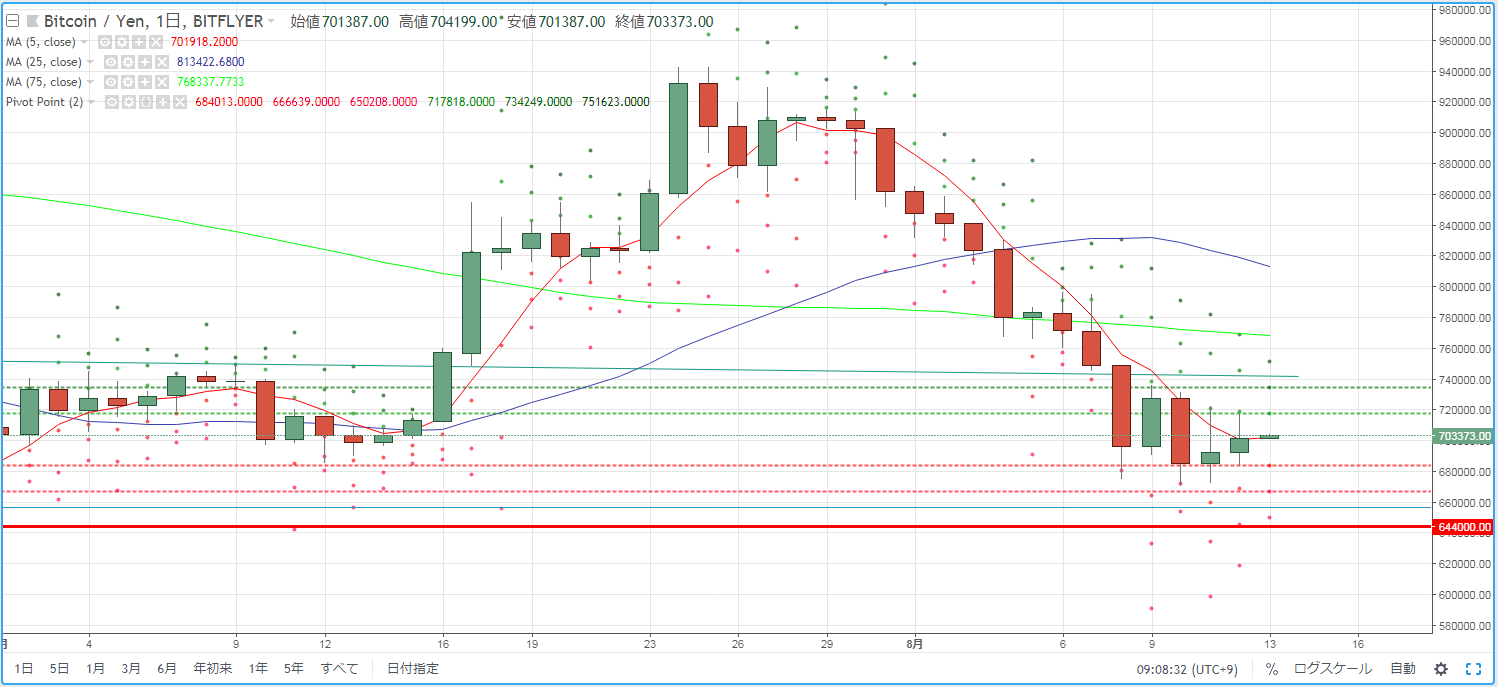
For day trading BTCJPY, we will check the pivot. Yesterday, although small, it formed two consecutive bullish candles and held without making a new low. If it falls today but stops at S1, it will not constitute a new low; if it goes down to S2, it will be a new low.
R2=734,249
R1=717,818
S1=684,013
S2=666,639
※ A pivot is a technical indicator that predicts the price movement range for the day based on the previous day's price action. Centered on the Pivot Point (PP), draw resistance lines (R1, R2) and support lines (S1, S2) above and below, and use them as guides for trading.
【Formulas】
Pivot Point (PP) = (previous day's close + high + low) / 3
Resistance Line 1 (R1) = PP + (PP - previous day's low)
Support Line 1 (S1) = PP - (previous day's high - PP)
Resistance Line 2 (R2) = PP + (previous day's high - previous day's low)
Support Line 2 (S2) = PP - (previous day's high - previous day's low)


