

【BTCJPY】20180812 Daily Pivot
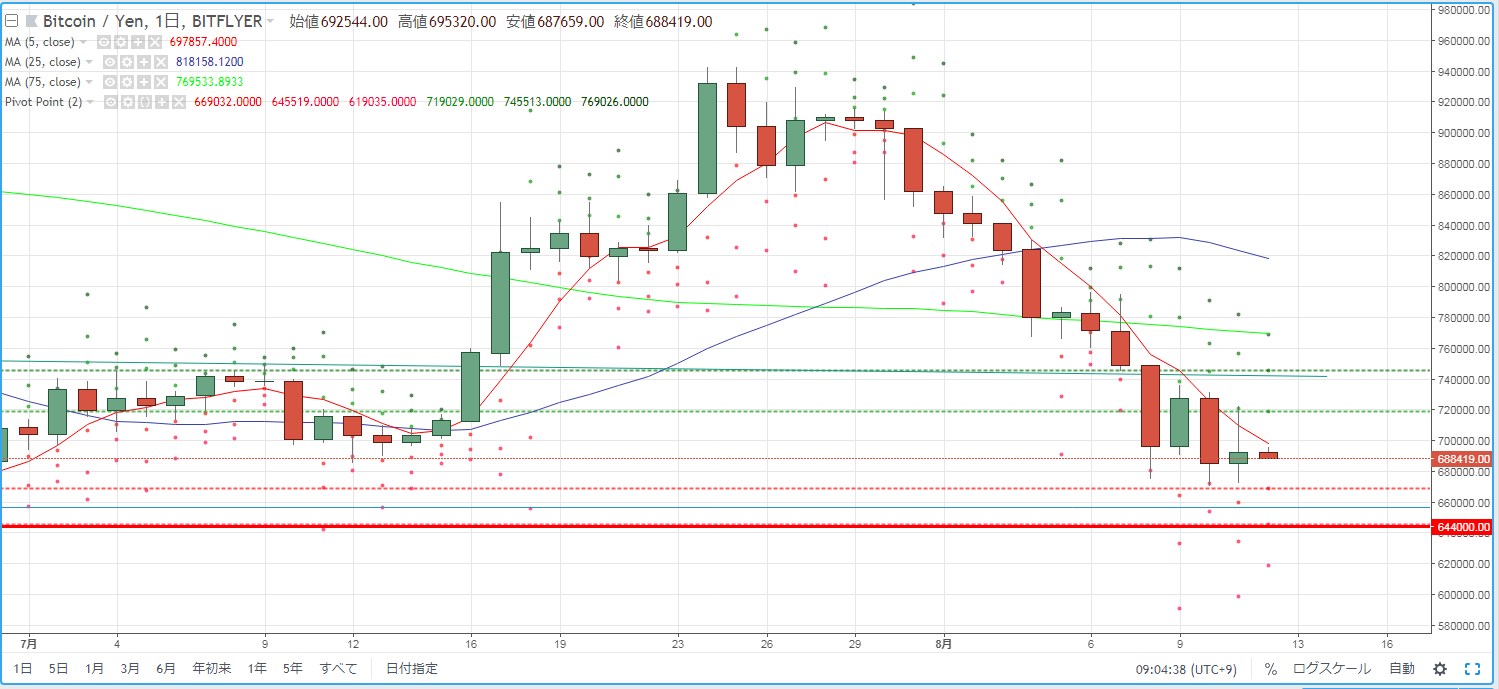
As a guide for day trading BTCJPY, we confirm the pivot. On the 10th, the price range of the bullish candlestick formed the previous day indicated a market environment where a strong down candle would push the price lower.
R2=745,513
R1=719,029
S1=669,032
S2=645,519
※ A pivot is a technical indicator that predicts the day's price movement based on the previous day's price action. Centered on the Pivot Point (PP), resistance lines (R1, R2) and support lines (S1, S2) are drawn above and below, and they are used as reference points for trading.
[Calculation Formula]
Pivot Point (PP) = (Previous day's close + previous day's high + previous day's low) / 3
Resistance Line 1 (R1) = PP + (PP - previous day's low)
Support Line 1 (S1) = PP - (previous day's high - PP)
Resistance Line 2 (R2) = PP + (previous day's high - previous day's low)
Support Line 2 (S2) = PP - (previous day's high - previous day's low)


