

【BTCJPY】20180811 Daily Pivot
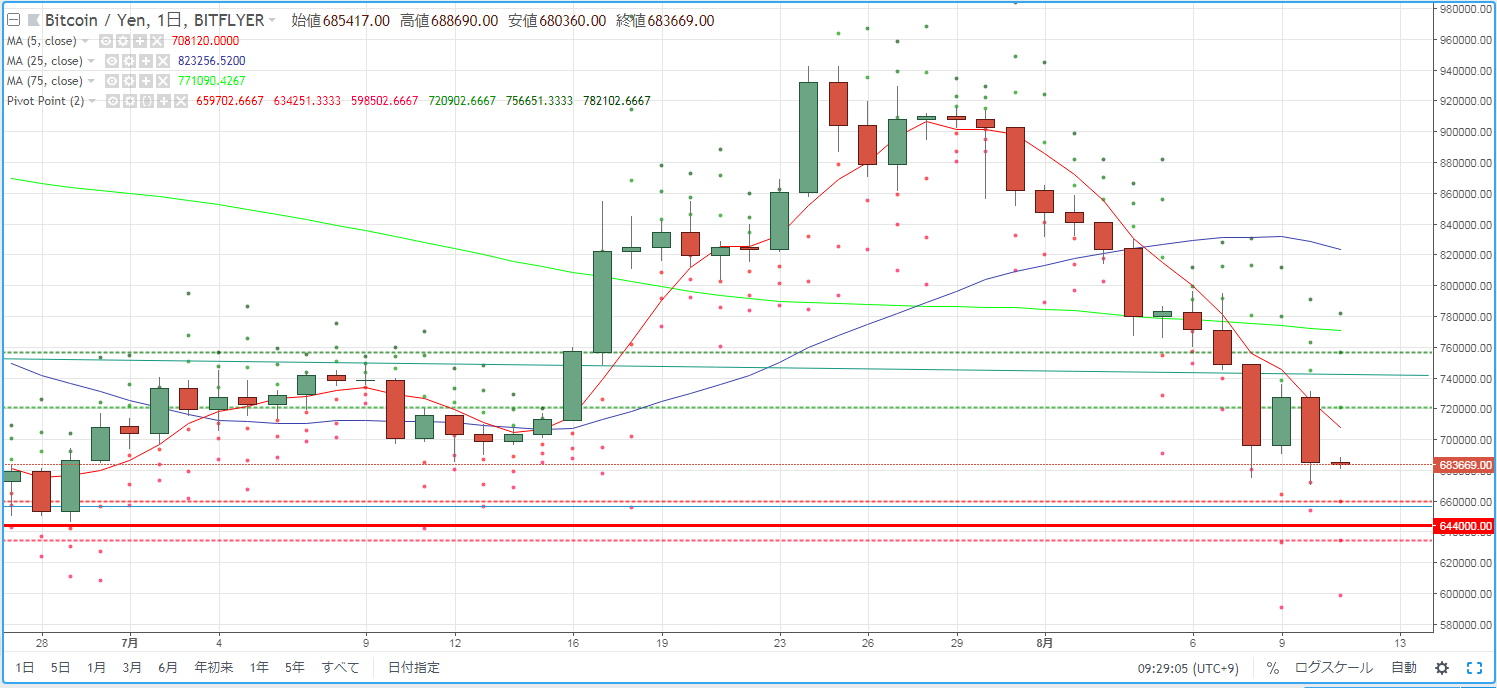
As a guideline for day trading BTCJPY, we verify the pivot. On the 10th, the market environment was such that the previous day's bullish candle range was expanded and a large bearish candle that updated the lower price was formed.
R2=756,651
R1=720,902
S1=659,702
S2=634,251
* Pivot points are a technical indicator used to estimate the day's price movement from the previous day's movement. Centered on the Pivot Point (PP), draw resistance lines (R1, R2) and support lines (S1, S2) above and below, and use them as trading guidelines.
[Calculation formula]
Pivot Point (PP) = (Previous Day's Close + Previous Day's High + Previous Day's Low) / 3
Resistance Line 1 (R1) = PP + (PP - Previous Day's Low)
Support Line 1 (S1) = PP - (Previous Day's High - PP)
Resistance Line 2 (R2) = PP + (Previous Day's High - Previous Day's Low)
Support Line 2 (S2) = PP - (Previous Day's High - Previous Day's Low)


