
First Session: Grasp the Psychology of Buyers and Sellers! [FX Planner]
The FX Planner's serialization "The Key to Technical Analysis" begins. As the subtitle suggests, this series will teach you the mindset for grasping the psychology of buyers and sellers.
【The Key to Technical Analysis [FX Planner]】
・Episode 1: Grasp the psychology of buyers and sellers!
・Episode 2: Grasp the perspective in the big trend!
・Episode 3: Establish your own entry criteria
・Episode 4: Possess the ability to judge when you don’t understand
・Episode 5: What to do after reaching your target
Episode 1 Table of Contents
1. How to grasp the psychology of both buyers and sellers
2. The flow to complete a trade
3. Find the traces of the Battle!
4. First, grasp the big trend!
How to grasp the psychology of both buyers and sellers
In the market, two forces, buyers and sellers, clash intensely while forming charts. And the candlesticks, which portray the trajectory of that movement, contain all the information.
Questions like “Where is the market currently headed?”, “Why are the forces balanced?”, “Why did it start moving from there?”, “What levels are important to both sides?”—all the information needed for trading can be explained solely by candlesticks.
Extracting all the information contained in candlesticks is the key point to accumulating profits in the market.
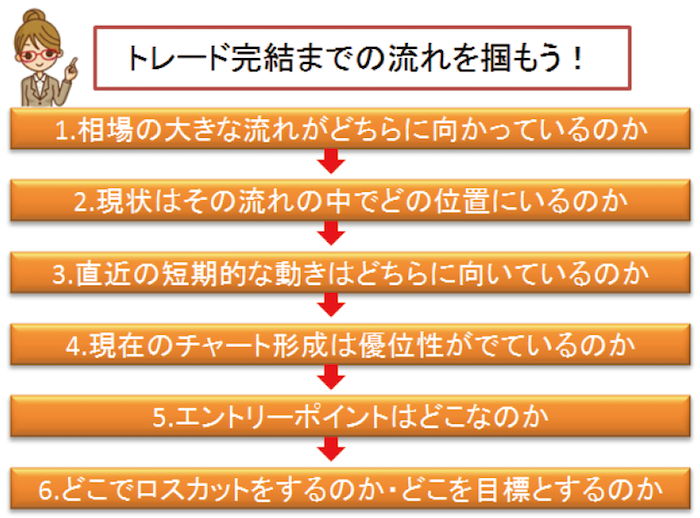
Flow to complete a trade
If you simply complete one FX trade by entering long or short and exiting, that would be the end. But,the purpose of FX is to increase assets.
To increase assets, you must consistently accumulate profits. Naturally, an ordinary entry makes it highly unlikely to achieve that goal. To repeat trades that accumulate profit, you need solid preparation for each trade.
① In which direction is the major market flow headed?
② In that flow, where is the current position?
③ What is the direction of the most recent short-term movement?
④ Is the current chart formation giving an advantage?
⑤ Where is the entry point?
⑥ Where to place the stop loss and where to set targets?
Prepare with the above flow. As you can see, all aspects up to the completion of the trade are determined in the preparation stage.
After that, you simply perform the act of entering, so this preparation is not an exaggeration to say it encompasses everything in trading. And all the information required for this preparation can be read from the candlestick trajectory, which embodies the psychology of buyers and sellers.
Find the traces of the Battle!
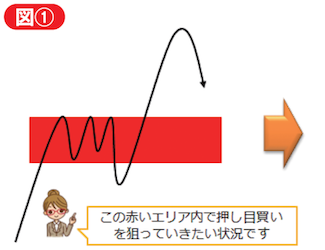
To read the psychology of buyers and sellers, you need to analyze candlestick movements carefully. To do this, you must read the chart properly. Look at Figure 1. What can you read from this chart?
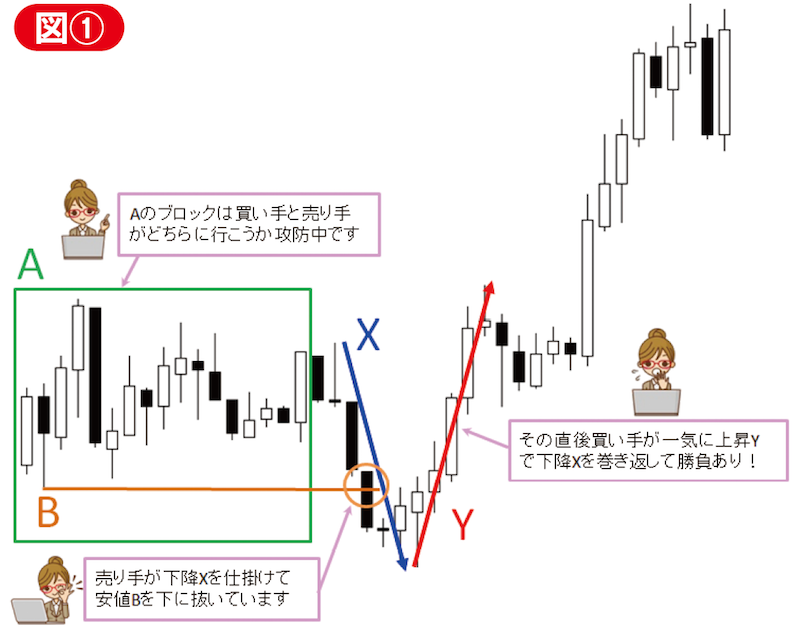
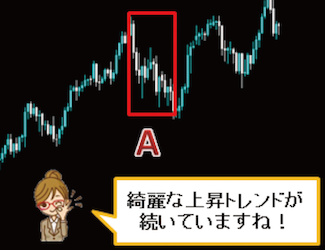
First, in Block A, price moves sideways and the forces of buyers and sellers are balanced. In other words, both sides are in the middle of a battle.
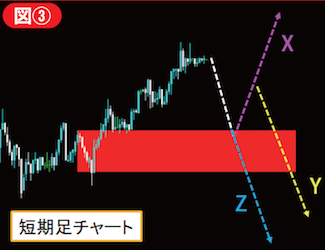
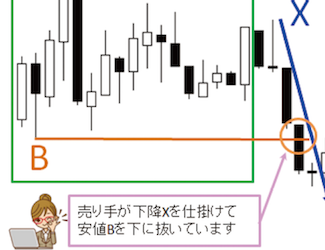
Next, the point to pay attention to is the movement of X. With the decline of X, it has broken below the recent low B. The sellers’ psychology at that moment is “Break below the low, settle this battle, and push into a downtrend.”
However, right afterward, the rise Y occurred, recovering all the prior decline X. The sellers launched the move to settle the battle, but the buyers brilliantly turned the move around. At this point, the sellers give up this battle, and the move turns upward, becoming the true settlement.
This movement is one of the typical forms that shows direction, but by following the sequence: battle start → sellers strike first (below the recent low) → buyers quickly turn the table, you can find movements that produce upward or downward trends.
First, grasp the big trends!
As mentioned above, the first thing in trade preparation is to see which direction the big trend is facing. This is the same as deciding whether to aim for long or short. The reason for deciding the direction is that small trends are more likely to be absorbed by the big trend.
For example, even if the current short-term movement is downward, if the big trend is upward, that short-term decline is likely to reverse and rise somewhere. If you cannot see the big trend, you might stubbornly aim for a short in a downward move and be unable to react when it gets absorbed by the rise, leading to a large loss.
If you read the long-term chart and analyze the buyers and sellers’ behavior, and if the movement like Figure 1 appears on the long-term chart and is rising, that is a signal to set your direction to long, and if it also appears on the shorter term chart, it is a signal to enter long.
First grasp the big trend and determine which direction is more likely to generate profits; this is the first step to succeeding in trading.
*This article is a revised edition of an article from FX攻略.com February 2017 issue