

RCI3 main line, support/resistance turning line, Fibonacci retracement, and mBDSR sign
Indicator that shines in combination with RCI: 【BODSOR・mBDSR】
and methods / case studies (PDF) ★GogoJungle AWARD2020 winner★
https://www.gogojungle.co.jp/tools/indicators/11836

In recent investment news+ articles,we introduce examples that show the high compatibility between various trading methods and the mBDSR signals.
EUR/USD Daily
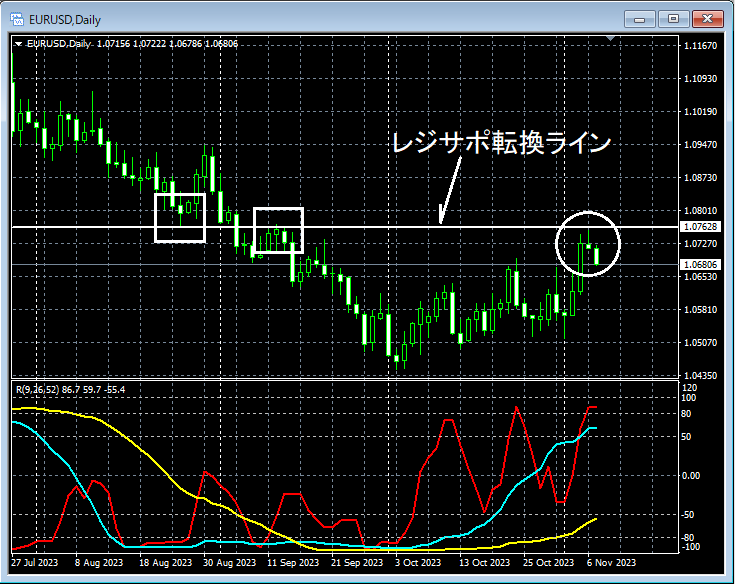
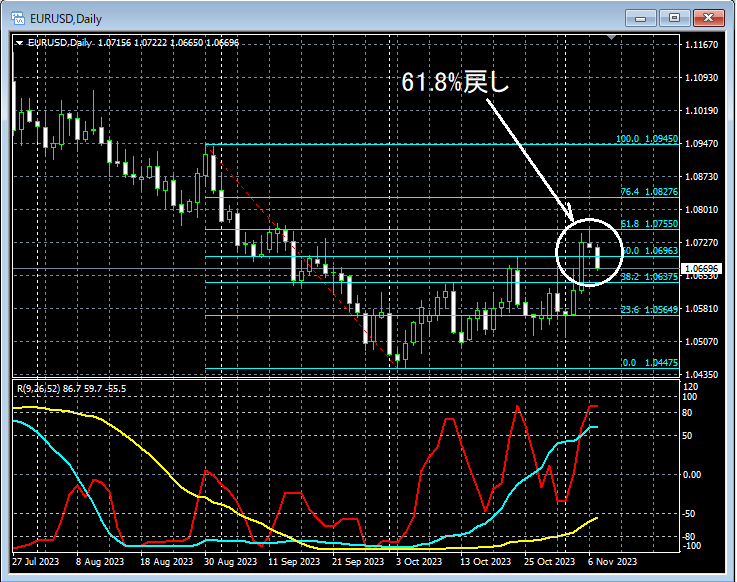
On the daily chart,breakout/turning lines of resistance become supportandFibonacci Retracement 61.8%to nearby levels.
EUR/USD 30-Minute
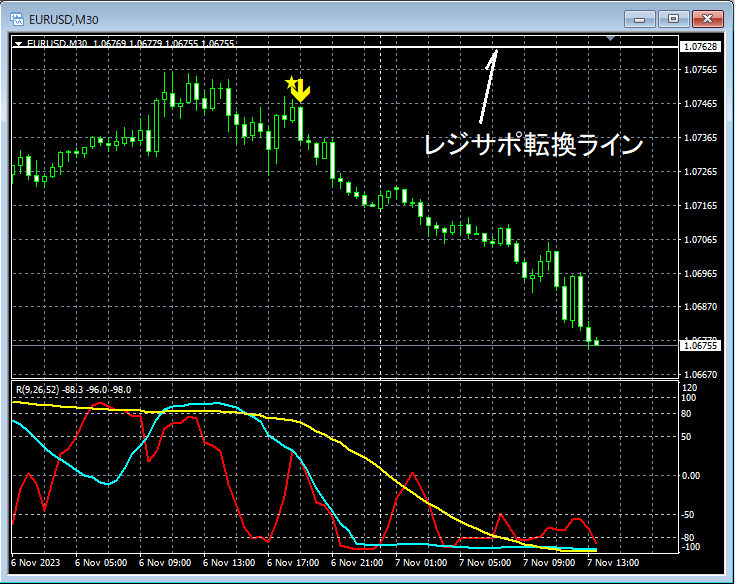
On the 30-minute chart,mBDSR (filters: RCI26 and RCI52) sell-back signallights up. Then it declines.
From this example,a trading method that focuses on resistance/support turning linesandtrading methods using Fibonacci retracementandmBDSR signalsshow high compatibility.
Also, in this example,placing the stop loss slightly above the recent highallows forhigh risk-reward trades.
Indicator that shines in combination with RCI: 【BODSOR・mBDSR】
https://www.gogojungle.co.jp/tools/indicators/11836
PDF files are attached in 250 copies.Most of them aresummaries of examples where logical linking of upper and lower timeframes is done using three RCI lines, and then the lower timeframe waiting for timing to buy on dips or sell on rallies (that is, mBDSR signals).In the explanations,more than 950 chartsare used.