

【BTCJPY】20180809 Daily Pivot
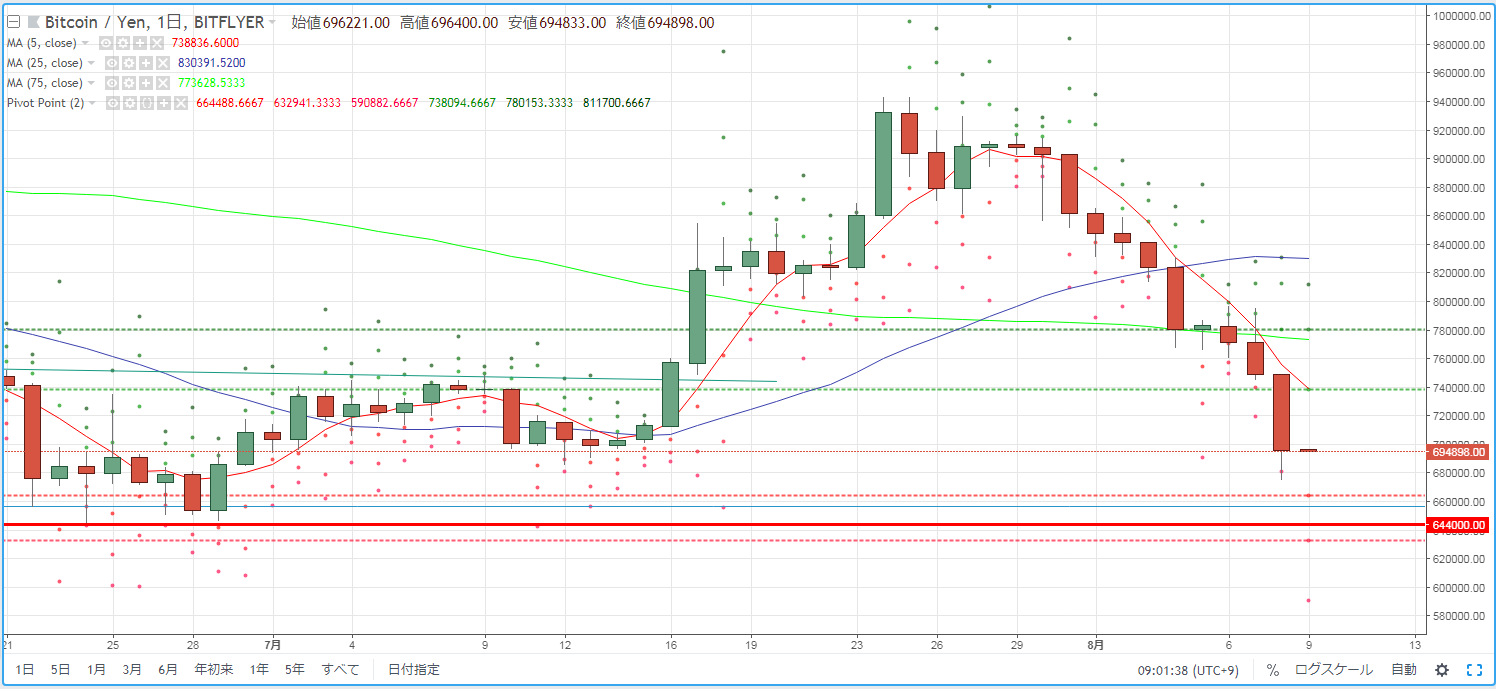
As a guideline for day trading BTCJPY, we check the pivot. Yesterday (August 8) the downward momentum did not stop, the price range widened, and a large bearish candle formed in the market environment.
R2=780,153
R1=738,094
S1=664,488
S2=632,941
※ A pivot is a technical indicator that estimates the price movement for the day from the previous day's price action. Centered on the Pivot Point (PP), draw resistance lines (R1, R2) and support lines (S1, S2) above and below, and use them as trading guides.
【Calculation Method】
Pivot Point (PP) = (Previous day's close + previous day's high + previous day's low) / 3
Resistance Line 1 (R1) = PP + (PP - previous day's low)
Support Line 1 (S1) = PP - (previous day's high - PP)
Resistance Line 2 (R2) = PP + (previous day's high - previous day's low)
Support Line 2 (S2) = PP - (previous day's high - previous day's low)


