

【BTCJPY】20180808 Daily Pivot
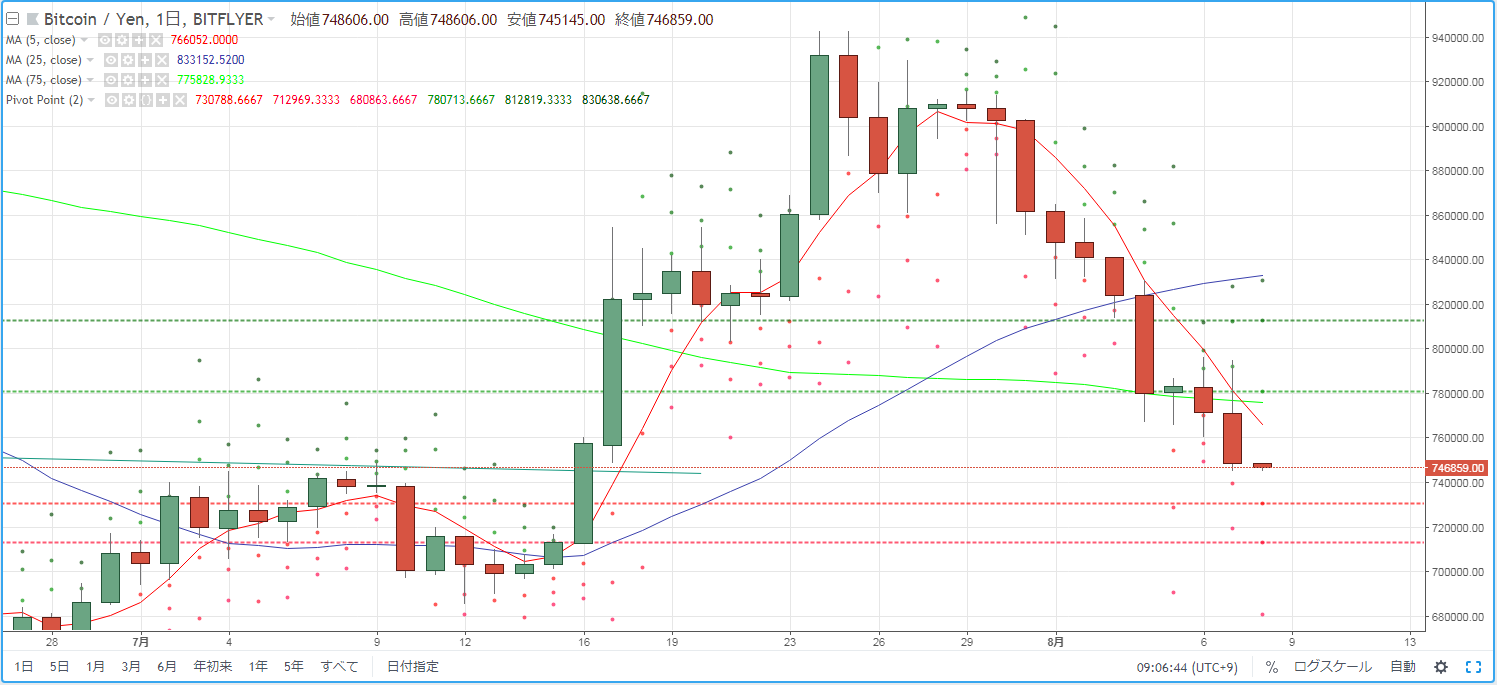
As a guideline for day trading BTCJPY, we will check the pivot. Yesterday (August 7) the body of the candlestick broke below the 75SMA, and the market environment accelerated to a decline.
R2=812,819
R1=780,713
S1=730,788
S2=712,969
※ A pivot is a technical indicator that forecasts the price range for the day based on the previous day's price movement. Centered on the Pivot Point (PP), draw resistance lines (R1, R2) and support lines (S1, S2) above and below, and use them as trading references.
【Formula】
Pivot Point (PP) = (Previous day's close + previous day's high + previous day's low) / 3
Resistance Line 1 (R1) = PP + (PP - previous day's low)
Support Line 1 (S1) = PP - (previous day's high - PP)
Resistance Line 2 (R2) = PP + (previous day's high - previous day's low)
Support Line 2 (S2) = PP - (previous day's high - previous day's low)


