

【BTCJPY】20180807 Daily Pivot
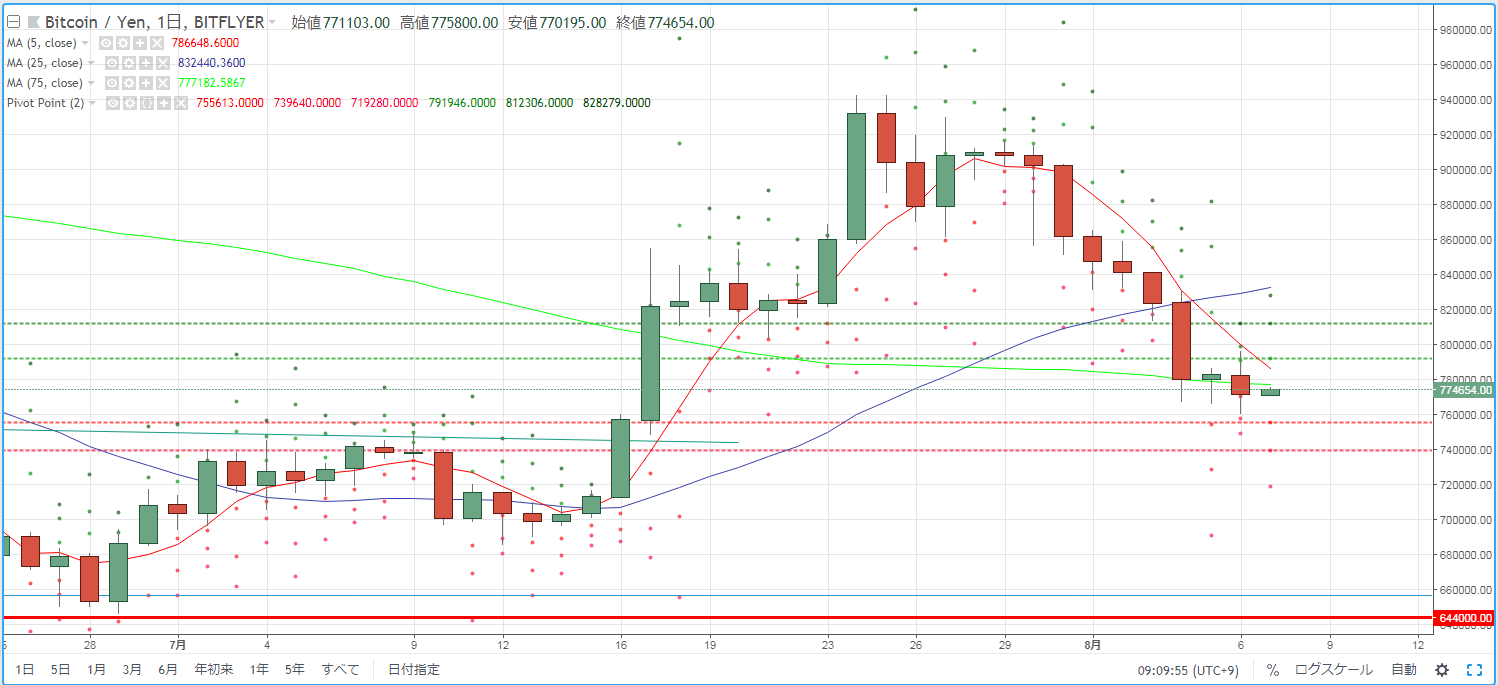
As a guide for intraday trading BTCJPY, we check the pivot. Yesterday (August 6) the market environment was one where the 75SMA, which had been acting as support, was broken by the close, forming another bearish session.
R2=812,306
R1=791,946
S1=755,613
S2=739,640
※ A pivot is a technical indicator that predicts the price movement for the current day based on the previous day's activity. Centered on the Pivot Point (PP), lines are drawn upward and downward for resistance (R1, R2) and support (S1, S2), and these are used as trading cues.
【Calculation】
Pivot Point (PP) = (Previous day's close + high + low) / 3
Resistance Line 1 (R1) = PP + (PP - Previous day's low)
Support Line 1 (S1) = PP - (Previous day's high - PP)
Resistance Line 2 (R2) = PP + (Previous day's high - previous day's low)
Support Line 2 (S2) = PP - (Previous day's high - previous day's low)


