【USDJPY】9-week chart - This week remains bullish as long as price stays above 109.30 yen
This article follows the weekly chart idea of “Nine-Weekly Charts” from the Ichimoku Kinko Hyo , based on the concept of the “nine-week foot” from the weekly charts of USD/JPY. For the basics of the nine-week chart, please refer to the following.
■ Official homepage of Ichimoku Kinko Hyo — Original publication for sale
http://www.ichimokukinkouhyou.jp/service/gencho.html
■ Ichimoku Kinko Hyo 2014 year 11 month Study Session Part 1 “Original Publication Visit – Weekly Edition …9 weeks chart and how to interpret the fixing line” Digest
https://www.youtube.com/watch?v=Kfw05Lc3y1g&index=9&t=0s&list=PL1337E09A66BCE968
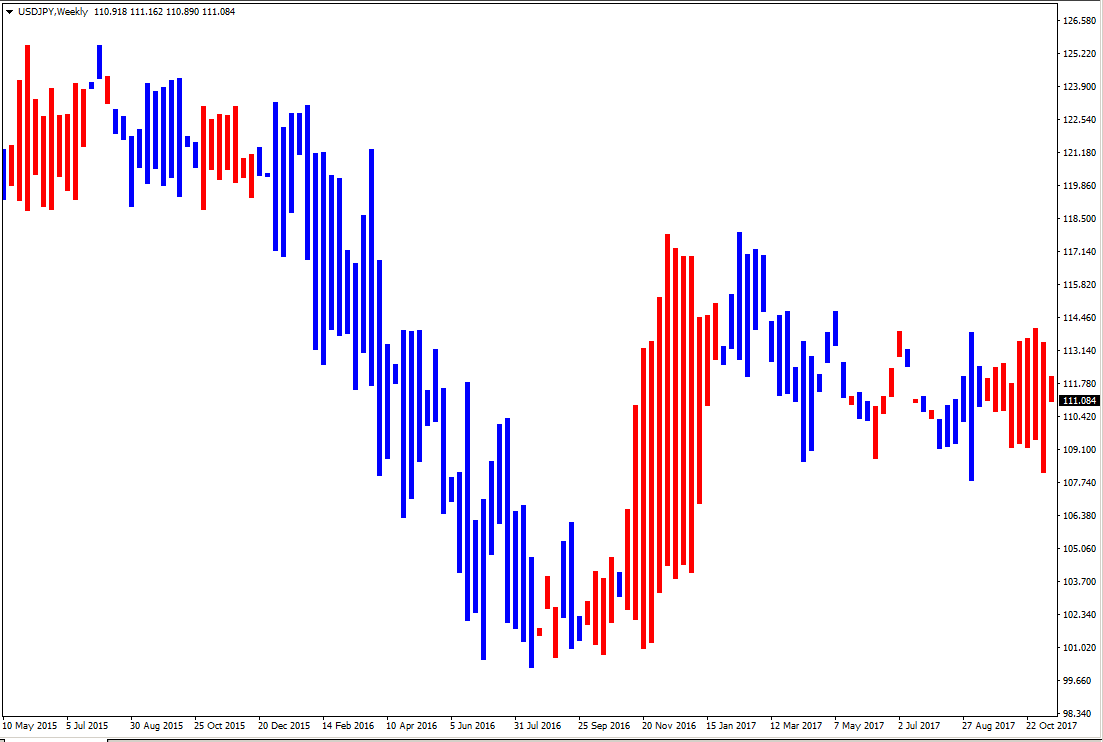
<2018 year 8 month 6 day Weekly USD/JPY (top: nine-week chart, bottom: weekly chart) >
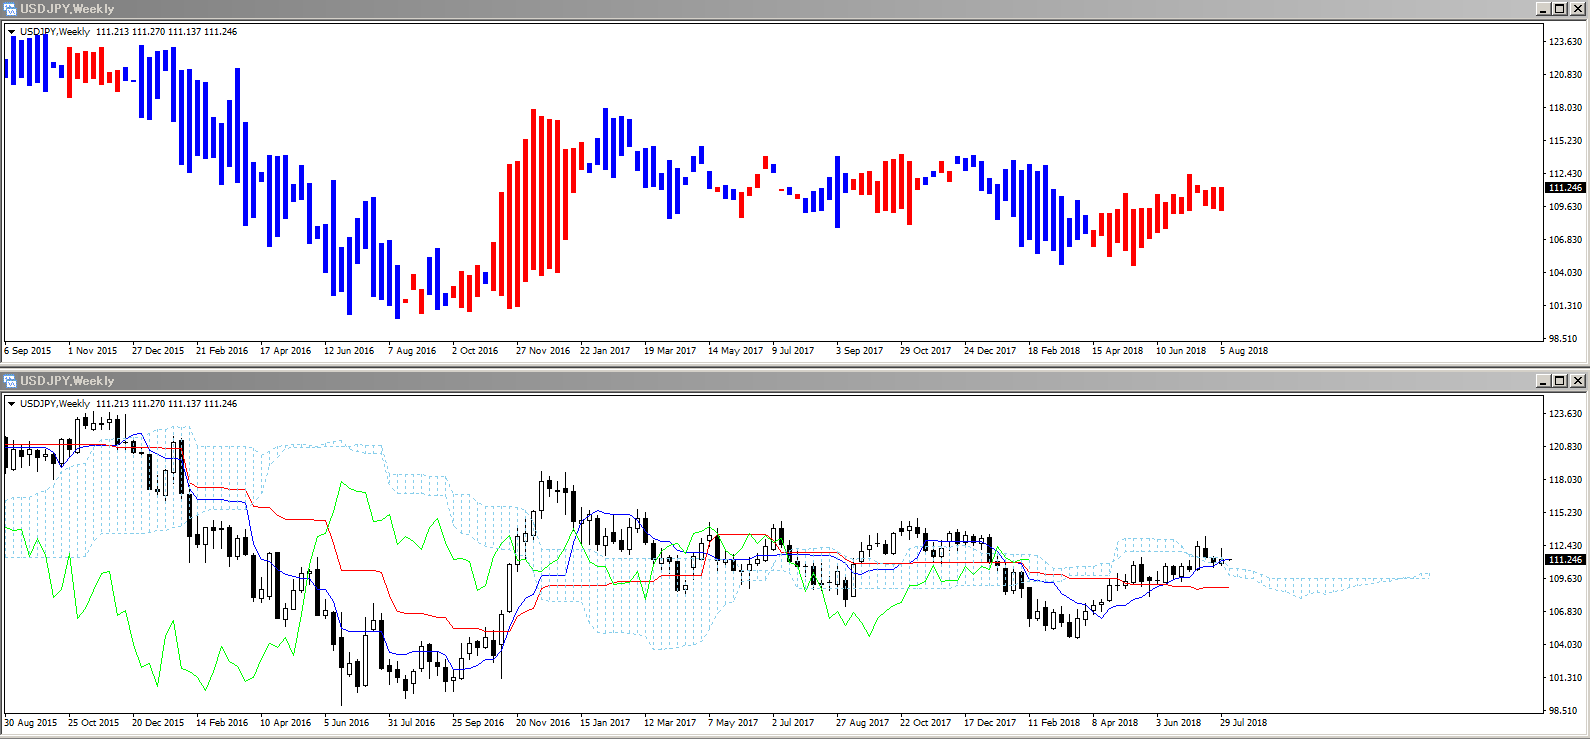
Currently, in a correction from 17 consecutive bearish days to 16 bullish days.8 month 6 day start of the nine-week chart is109.30 yen, and if this is not broken, it will become 17 bullish days. Note that future nine-week chart start values are as follows. These start values can be anticipated, helping to foresee consecutive or turning points on the nine-week chart.
8 month 06 day weekly:109.30 yen
8 month 13 day weekly:110.64 yen
8 month 20 day weekly:109.83 yen
8 month 27 day weekly:110.64 yen
9 month 03 day weekly:110.41 yen
9 month 10 day weekly:112.18 yen
9 month 17 day weekly:111.35 yen
9 month 24 day weekly:110.91 yen
10 month 01 day weekly:111.21 yen
For those who want to learn more about the Ichimoku Kinko Hyo, click here.
■ Official homepage of Ichimoku Kinko Hyo — Information about the Ichimoku Kinko Hyo Club
http://www.ichimokukinkouhyou.jp/service/club.html