

【BTCJPY】20180806 Daily Pivot
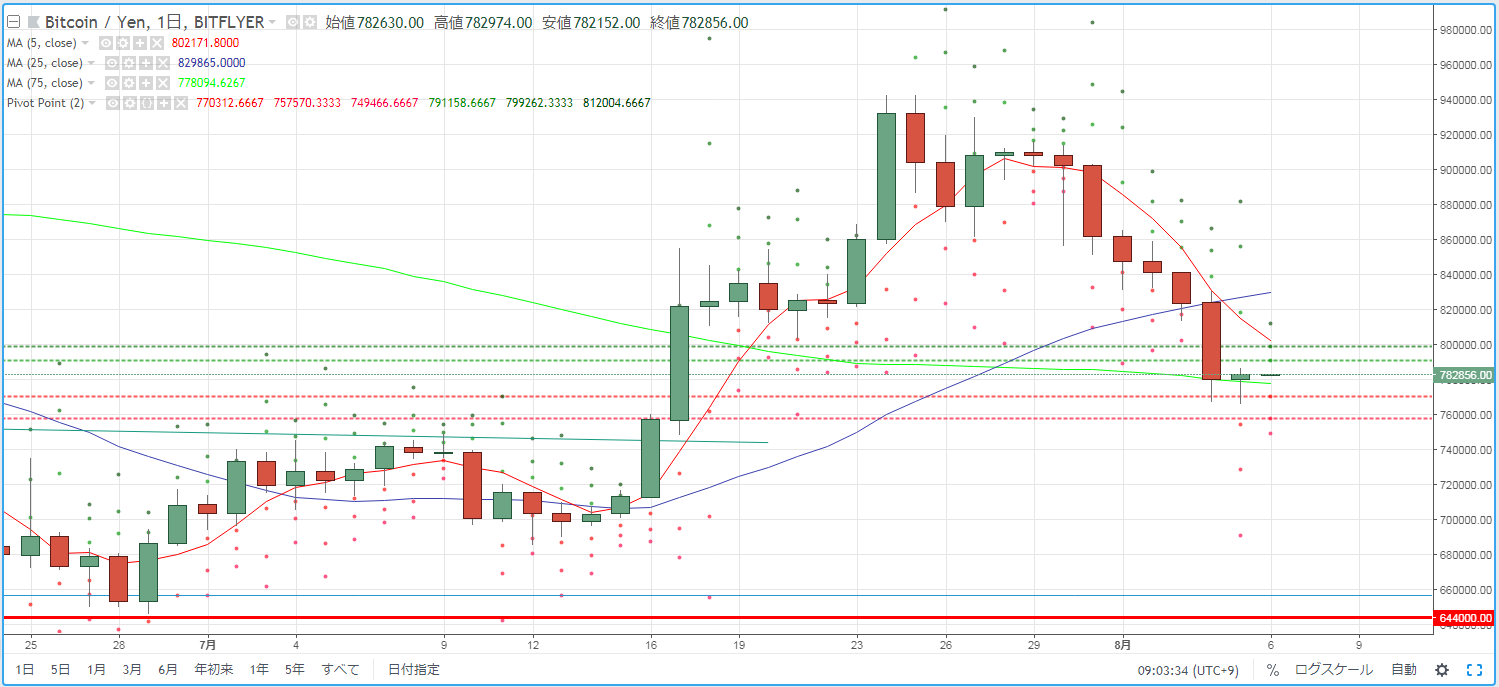
As a guideline for day trading BTCJPY, we check the pivot. Yesterday (August 5) the market did not close above the 75SMA on the body, and it was a market environment that printed a bullish candle for the first time in eight days.
R2=799,262
R1=791,158
S1=770,312
S2=757,570
※ A pivot is a technical indicator that estimates the potential price movement for the day based on the previous day's activity. Centered on the Pivot Point (PP), draw resistance lines (R1, R2) above and below and support lines (S1, S2) below, and use them as trading guidelines.
【Calculation formula】
Pivot Point (PP) = (Previous day’s close + previous day’s high + previous day’s low) / 3
Resistance Line 1 (R1) = PP + (PP - previous day’s low)
Support Line 1 (S1) = PP - (previous day’s high - PP)
Resistance Line 2 (R2) = PP + (previous day’s high - previous day’s low)
Support Line 2 (S2) = PP - (previous day’s high - previous day’s low)


