

【BTCJPY】Can it hold with a figurative “pinch bottom” formation?
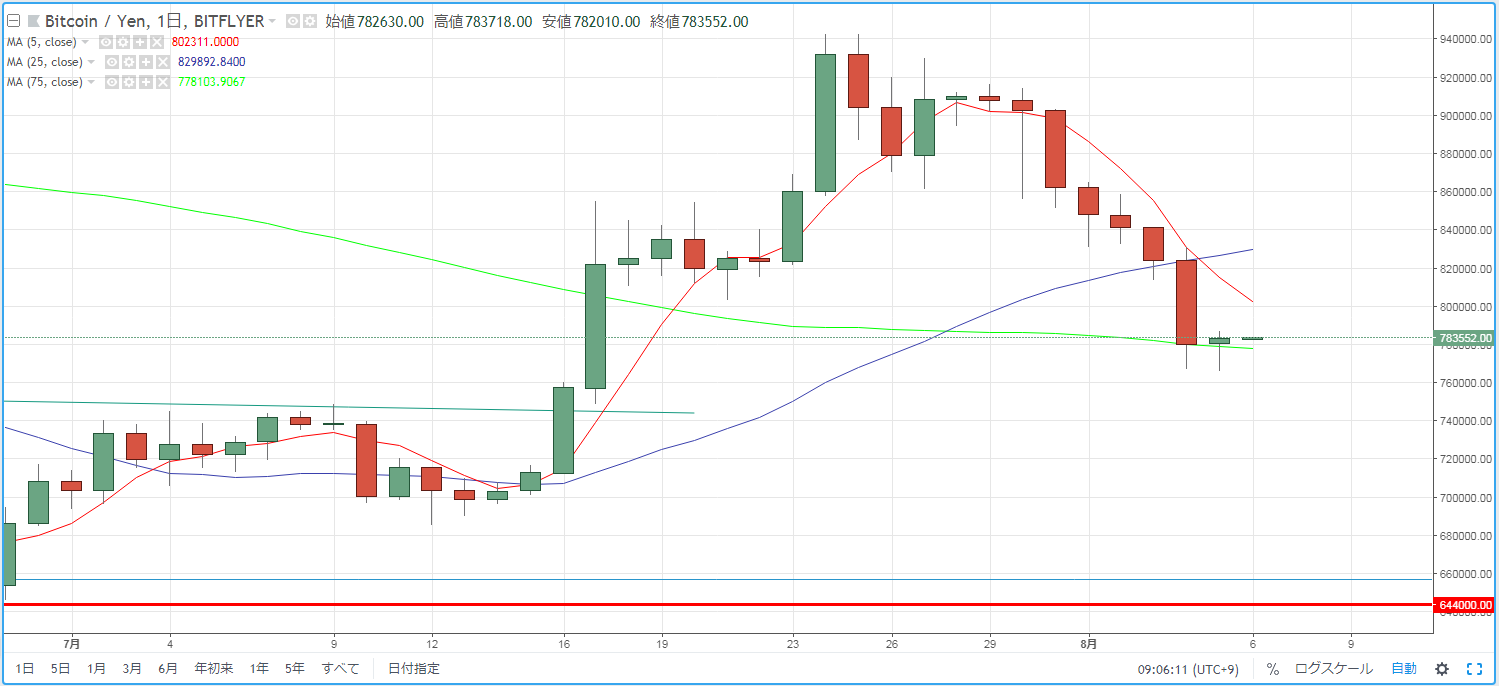
On August 5th's post titled "【BTCJPY】 breaks below the 25SMA and 75SMA," I noted the formation of a strong bearish candlestick that even broke below the 75SMA, and I expressed interest in whether it could rebound here. In reality, it managed to hold somewhat and formed a bullish candle. And on the chart, a hammer-bottom chart pattern (a pattern suggesting a reversal to an upward move) appeared. The wick extended below the 75SMA at the same level, while the body was on the top side. Today, I would like to focus on whether this relationship can be maintained.
× ![]()


