The Way of Investment (Part 90)
The Way of Investment (Part90)
“Autumn Festival Special Edition”
The future is unpredictable
1. In real charts, the right half cannot be seen (the future side has not yet been drawn), how do we deal with this?
This is something always present in the world of investing, as discussed in the previous “The Way of Investment (Part88)”. It is also said that the future is unpredictable or that “the future is inherently unpredictable.” Of course, the future of investing is not completely random; to some extent, it reflects past and current conditions, and then the next future arrives.
I attempted to analyze it mathematically with time-series correlation analysis, but I only found things that didn’t work.
So I decided to stop trying to forecast the future and instead take a more realistic approach.
2.
Try using the “Daily Low-High Extremes Indicator”
“Daily Low-High Extremes Indicator”GoGoJangan productID41351 overview.
2Graph the difference in currency strength between two currencies, buy the stronger currency, and sell the weaker one—a genuine “The Way of Investment” indicator. It detects highs and lows on the daily chart and uses a don-tengen (reversal) approach to aggressively seek profits. It is particularly suitable for currencies with a negative correlation.
The figure below shows the AUDCHF daily chart with the “AUDCHF daily chart and the “Daily Low-High Extremes Indicator” applied and optimized.
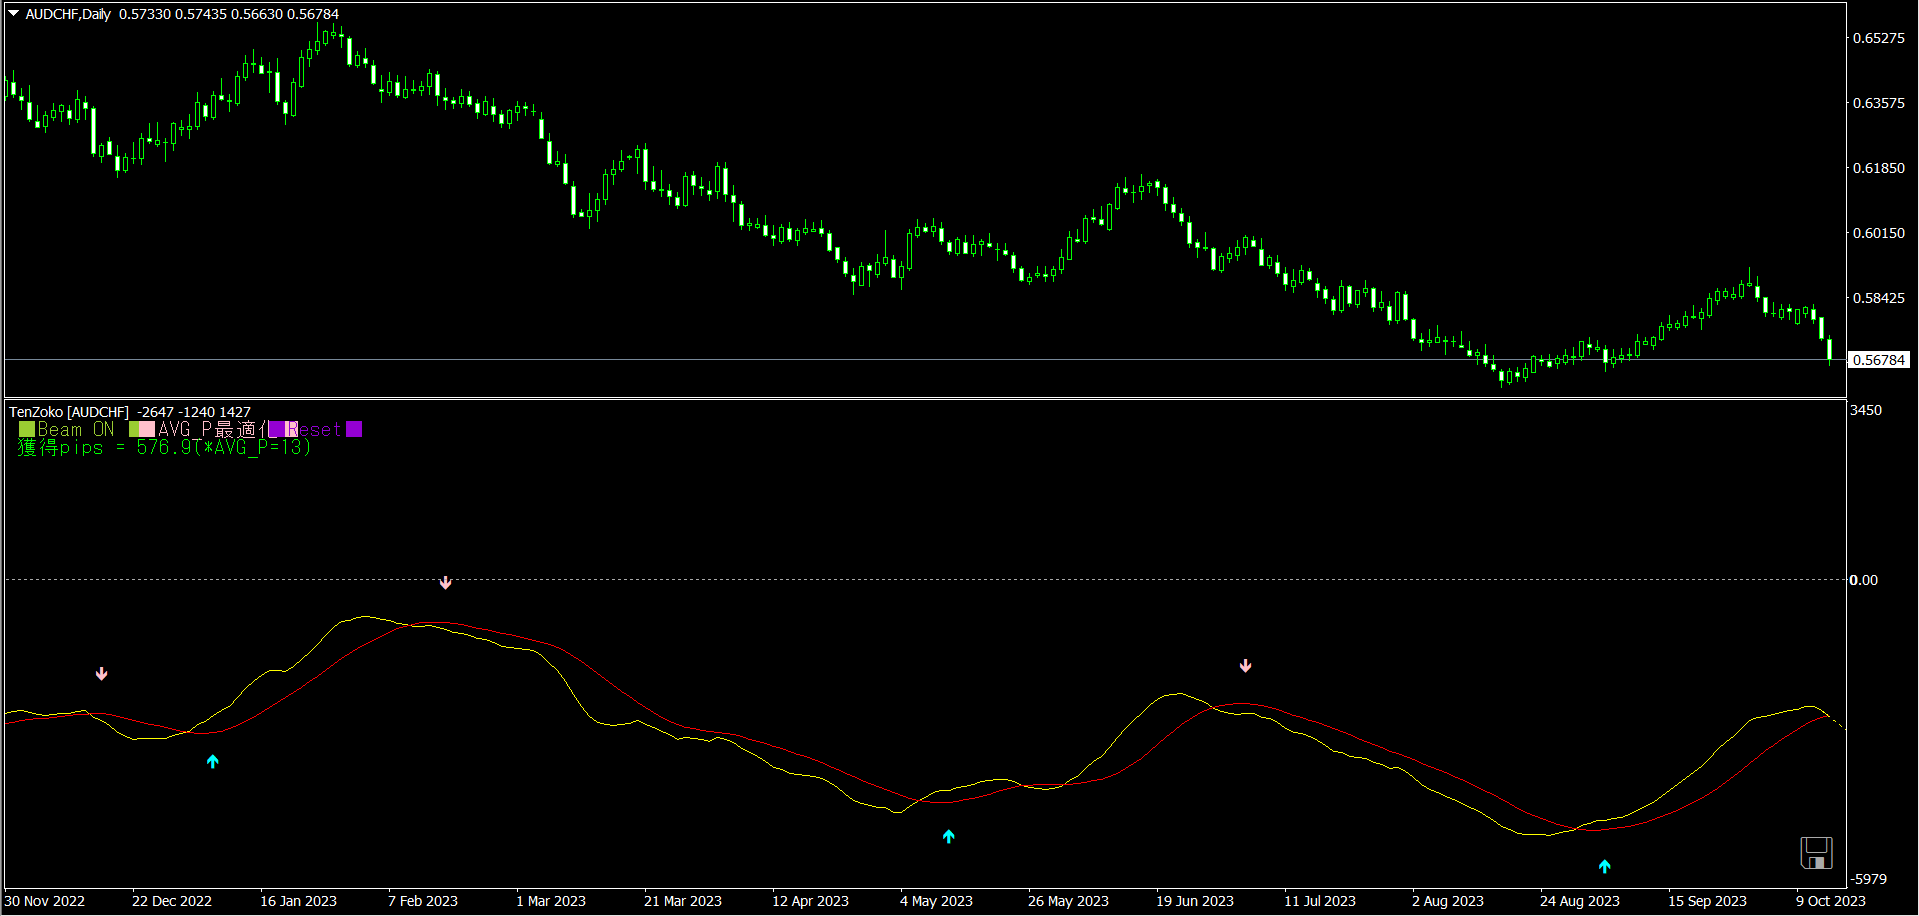
In January 2023 to October 2023, five arrows appeared. This indicator uses moving averages in its calculation, so the arrows appear slightly after the highs and lows on the chart.
In actual chart highs and lows, arrow positions appear lagging by 4 to 11 candles.
I examined how this lag affects the profits actually obtained.
Chart highs/lows Lag Chart values Lag values
(1)
Low(Buy) 4 0.62131 0.63764
(2)
High(Sell) 11 0.65423 0.63611
(3)
Low(Buy) 7 0.59232 0.59646
(4)
High(Sell) 9 0.61317 0.59997
(5)
Low(Buy) 10 0.56469 0.56722
October130.56784
Result of the reversal trading0.16731 0.07500 (44.8%)
Using this indicator can yield decent profits, but compared to ideal buying and selling at the chart’s high/low points, the profits are reduced by about45%.
As the market proverb goes, “give up the head and the tail,” though it may feel somewhat wasteful.