

【BTCJPY】20180804 Daily Pivot
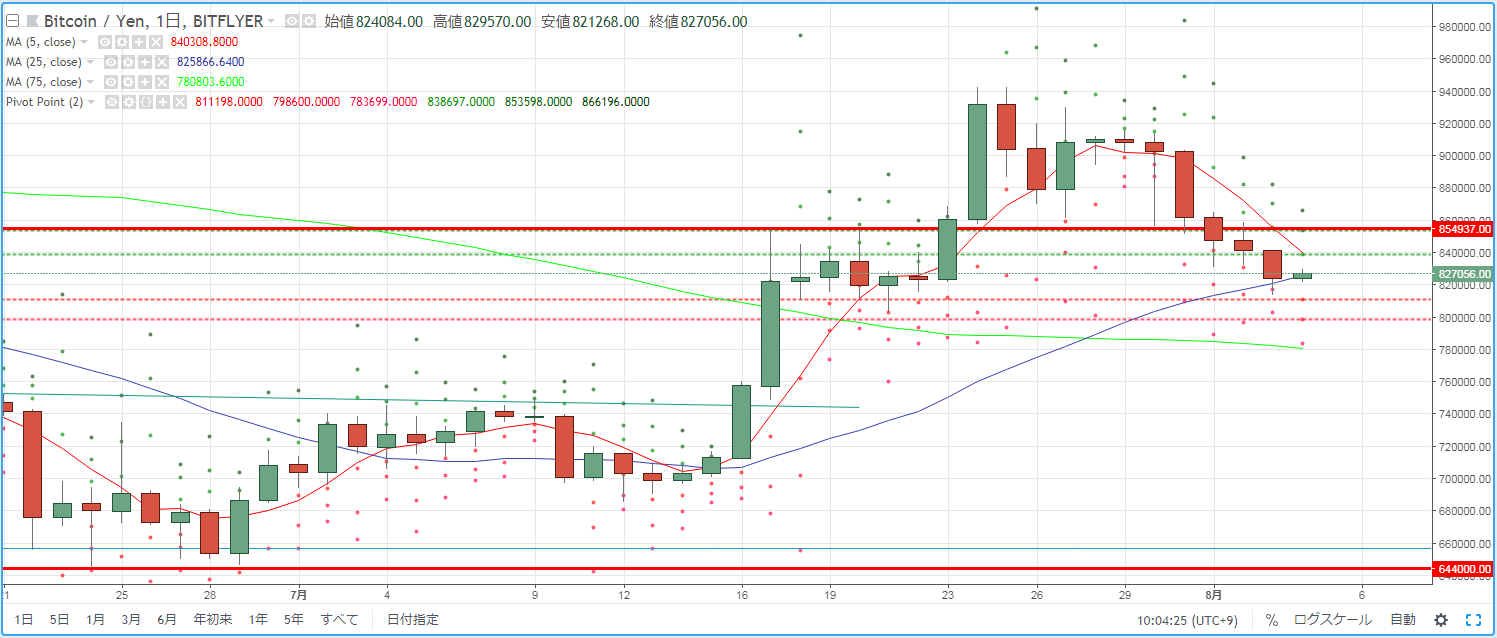
As a guide for day trading BTCJPY, we check the pivot. The past three days saw a continued decline for six days in a row. However, the market environment showed a temporary rebound at the 25SMA.
R2=853,598
R1=838,697
S1=811,198
S2=798,600
※ A pivot is a technical indicator that predicts the price movement for the day based on the previous day's price movement. Centered on the Pivot Point (PP), resistance lines (R1, R2) and support lines (S1, S2) are drawn above and below, and these are used as trading benchmarks.
【Calculation Formula】
Pivot Point (PP) = (Previous Day's Close + Previous Day's High + Previous Day's Low) / 3
Resistance Line 1 (R1) = PP + (PP - Previous Day's Low)
Support Line 1 (S1) = PP - (Previous Day's High - PP)
Resistance Line 2 (R2) = PP + (Previous Day's High - Previous Day's Low)
Support Line 2 (S2) = PP - (Previous Day's High - Previous Day's Low)


