

【BTCJPY】20180803 Daily Pivot
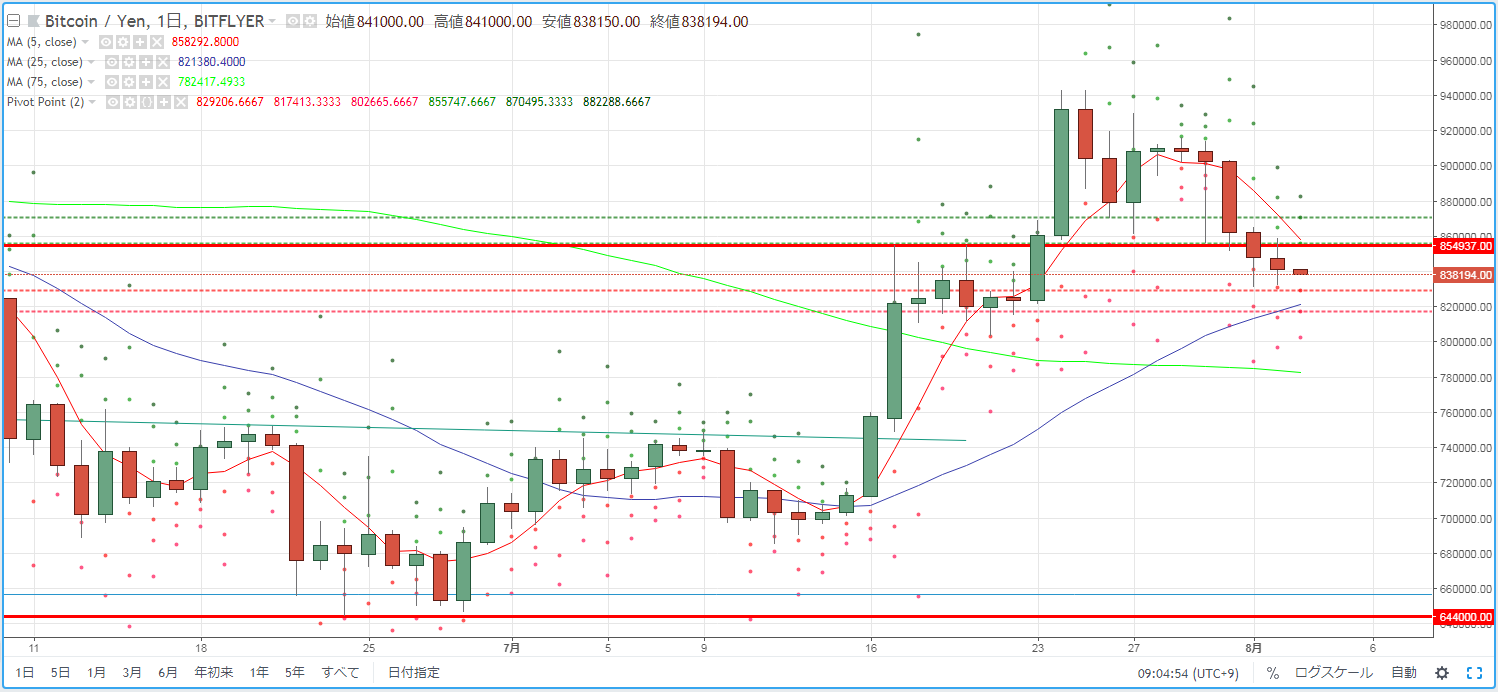
As a guideline for day trading BTCJPY, we check the pivot. Yesterday (August 2) the market was moving back toward the most recent low level.
R2=870,495
R1=855,747
S1=829,206
S2=817,413
※ A pivot is a technical indicator that predicts the price movement range for the day based on the previous day's price movement. Centered around the pivot point (PP), we draw resistance lines (R1, R2) above and below, and support lines (S1, S2) below, using them as trading guidance.
【Calculation formula】
Pivot Point (PP) = (Previous day's close + previous day's high + previous day's low) / 3
Resistance Line 1 (R1) = PP + (PP - previous day's low)
Support Line 1 (S1) = PP - (previous day's high - PP)
Resistance Line 2 (R2) = PP + (previous day's high - previous day's low)
Support Line 2 (S2) = PP - (previous day's high - previous day's low)


