

October 12 (Thu): [Harmonic] Nikkei 225 VS US 10-Year Treasury Yield (Course: Is it necessary to look at the correlation?)
Good morning ⛅
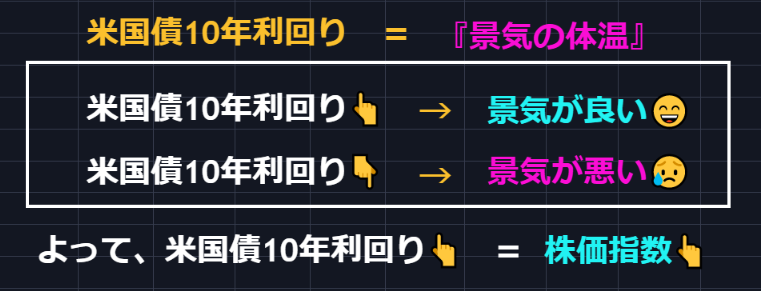
Today we will look at a comparison with the "10-year U.S. Treasury yield," but
before that, a recap?
Charts do not move in isolation.
Everything is interconnected and linked.
That is why you can find some hint by looking at the [correlation].
In both "Bollinger Band Explanatory Notes" and "Harmonic Prescriptions,"
the section on [correlation] is included.
The [correlation] also functions with indicators and drawing tools.
Rather than just looking at one chart and saying I don’t understand, please be sure to look at multiple charts for the instrument you trade.
I mostly trade only the Nikkei 225, but
Dow Jones
NASDAQ
S&P 500
Russell 2000
USD/JPY
10-year U.S. Treasuries yield
GOLD
Bitcoin
Ethereum
I watch charts in this area.
And I wonder if there is any hint somewhere?
That’s what I’m searching for.
Do we need to look at [correlation]?
The answer is…Absolutely necessary!!!
Now again, today I plan to compare with the “10-year U.S. Treasury yield.”
(Note: The following content is restricted to members only.)


