

October 12 (Thu): [Bollinger Bands] Nikkei 225 vs U.S. 10-year Treasury yield (Course: Do we need to look at the correlation?)
Good morning ⛅
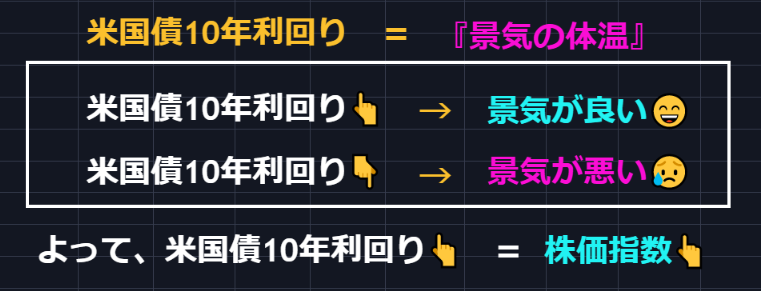
Today we will look at a comparison with the “U.S. 10-Year Treasury Yield.”
But first, a review?
The charts do not move in isolation.
Everything is interconnected and linked together.
That’s why by looking at correlations you can find some hints.
In both “The Unofficial Guide to Bollinger Bands” and “The Prescription for Harmonics,”
the topic of【Correlation】is included.
Correlation also works with indicators and drawing tools.
Rather than just looking at one chart and saying I don’t understand, please view multiple charts for the instruments you trade.
I trade almost only the Nikkei 225, but
NY Dow
NASDAQ
S&P 500
Russell 2000
Dollar-Yen
U.S. 10-year Treasury yield
GOLD
Bitcoin
Ethereum
I watch charts in this area.
And is there any hint somewhere?
That’s what I’m looking for.
Do we need to look at correlations?
The answer is…Absolutely necessary!!!
Now again, today I intend to compare with the “U.S. 10-Year Treasury Yield.”
(Note: The following content is restricted to members only.)


