

【BTCJPY】20180802 Daily Pivot
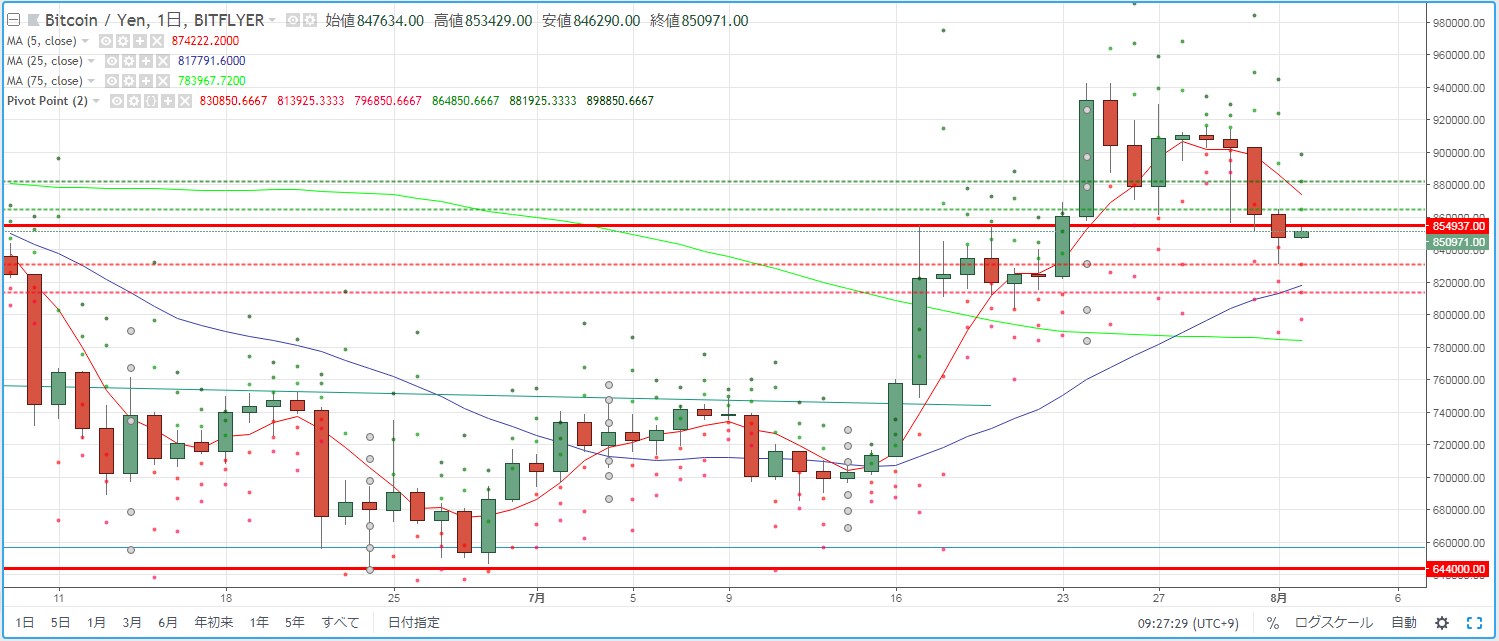
For day trading BTCJPY, we check the pivot. Yesterday (August 1) continued the downtrend from July 30 and ended with a bearish candle, indicating the current market environment.
R2=881,925
R1=864,850
S1=830,850
S2=813,925
※ A pivot is a technical indicator that predicts the day's price movement range based on the previous day's movements. Centered on the Pivot Point (PP), draw resistance lines (R1, R2) and support lines (S1, S2) above and below, and use them as trading guides.
【Calculation Formula】
Pivot Point (PP) = (Previous Day Close + Previous Day High + Previous Day Low) / 3
Resistance Line 1 (R1) = PP + (PP - Previous Day Low)
Support Line 1 (S1) = PP - (Previous Day High - PP)
Resistance Line 2 (R2) = PP + (Previous Day High - Previous Day Low)
Support Line 2 (S2) = PP - (Previous Day High - Previous Day Low)


