

[October 6, 2023] Backtesting using the Sky-and-Earth Indicator and Abusan Signals (Pounder)
Previous Chart Analysis Article I would like to verify what happened to the pound/dollar which I judged to be bearish in the lower timeframes. This time「Abusan Signal」 entry points will be introduced.
・This article mainly focuses on chart analysis and backtesting using the“Heaven and Earth Indicators”.
・The content is structured based on using the“15-minute + 4-hour simultaneous monitoring method”“15-minute + 4-hour simultaneous monitoring method” as the premise.
・This tool is a groundbreaking trading tool that can be used even without understanding the so-called FX theories (Elliott Wave, Dow Theory, Grail’s Law, cycle theory, price action, Fibonacci, support/resistance, channels, etc.).

Heaven and Earth Indicators is a trading method using my original indicator released in February 2022.
Thanks to everyone's support,“GogoJungle Award 2022 has been awarded to me.
■ Heaven and Earth Indicators
https://www.gogojungle.co.jp/tools/indicators/35780
■ Heaven and Earth Mountain
https://www.gogojungle.co.jp/tools/indicators/37744
■ Heaven and Earth EA ~ Semi-discretionary Auto Trading System ~
https://www.gogojungle.co.jp/tools/indicators/43213
■ Heaven and Earth Dashboard
https://www.gogojungle.co.jp/tools/indicators/46257">https://www.gogojungle.co.jp/tools/indicators/46257">https://www.gogojungle.co.jp/tools/indicators/46257https://www.gogojungle.co.jp/tools/indicators/46257
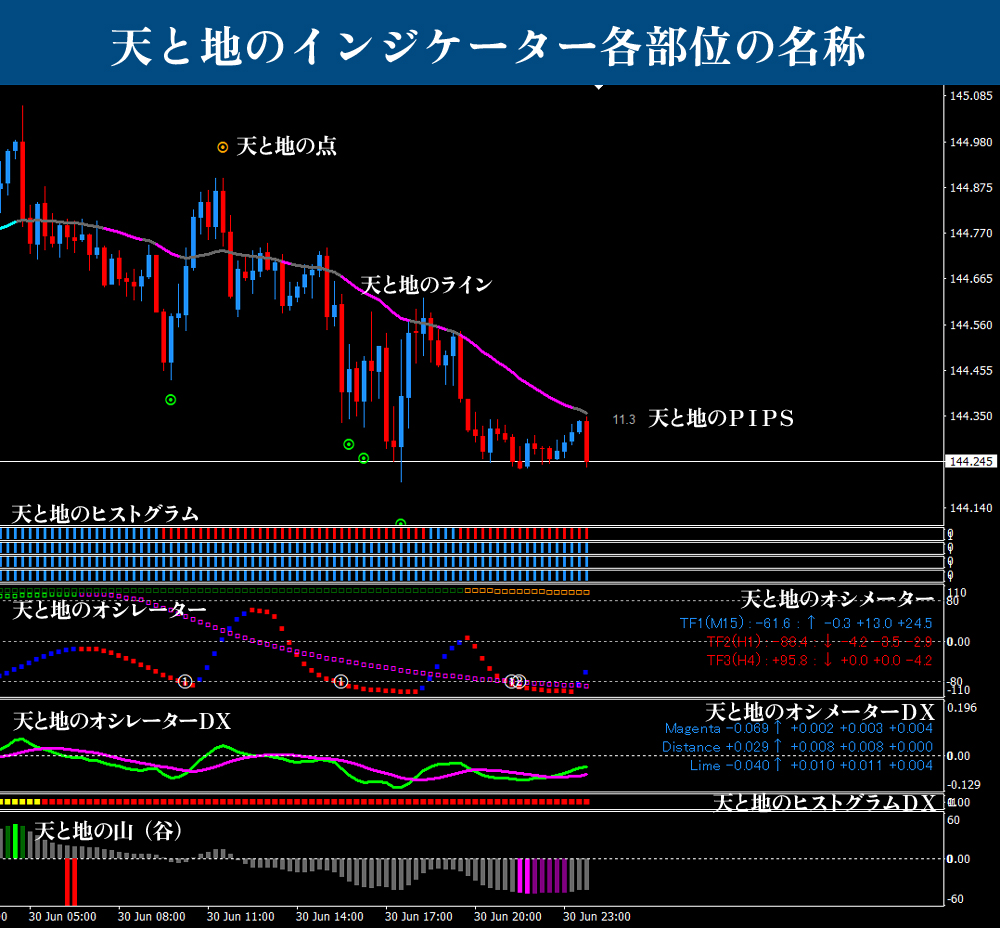
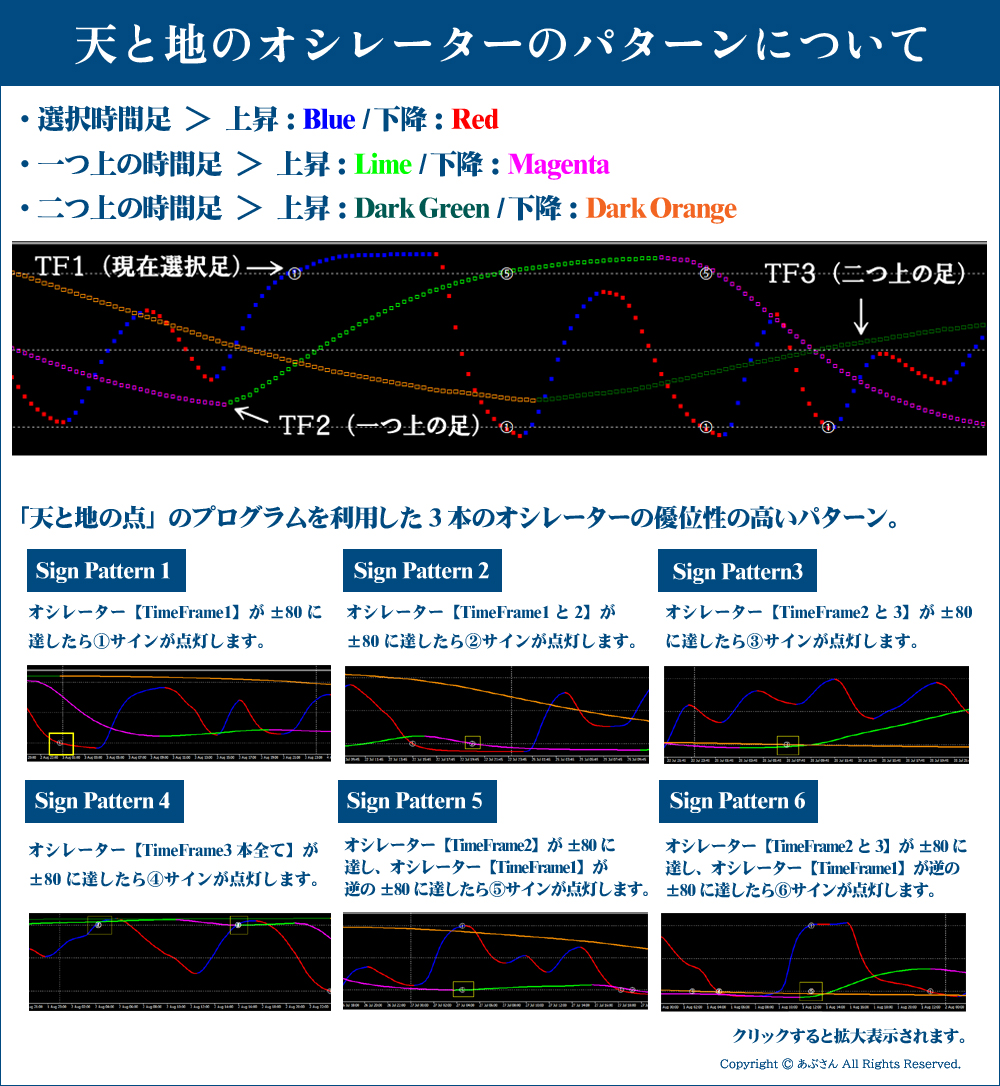
※ Regarding specialized terms used in this blog, please refer to the below items: “Names of each part of Heaven and Earth Indicators” and “Patterns of Heaven and Earth Oscillators.” If you have any other questions, you can usually understand by referring to the Heaven and Earth Indicators sales page. For existing users, reading the user manual should suffice. If you have any other questions, please refer to the Heaven and Earth Indicators sales page. Already, users should have no issue after reading the manual.
Now, I would like to move on to verification.
Thank you in advance!
※ All images can be enlarged by clicking.

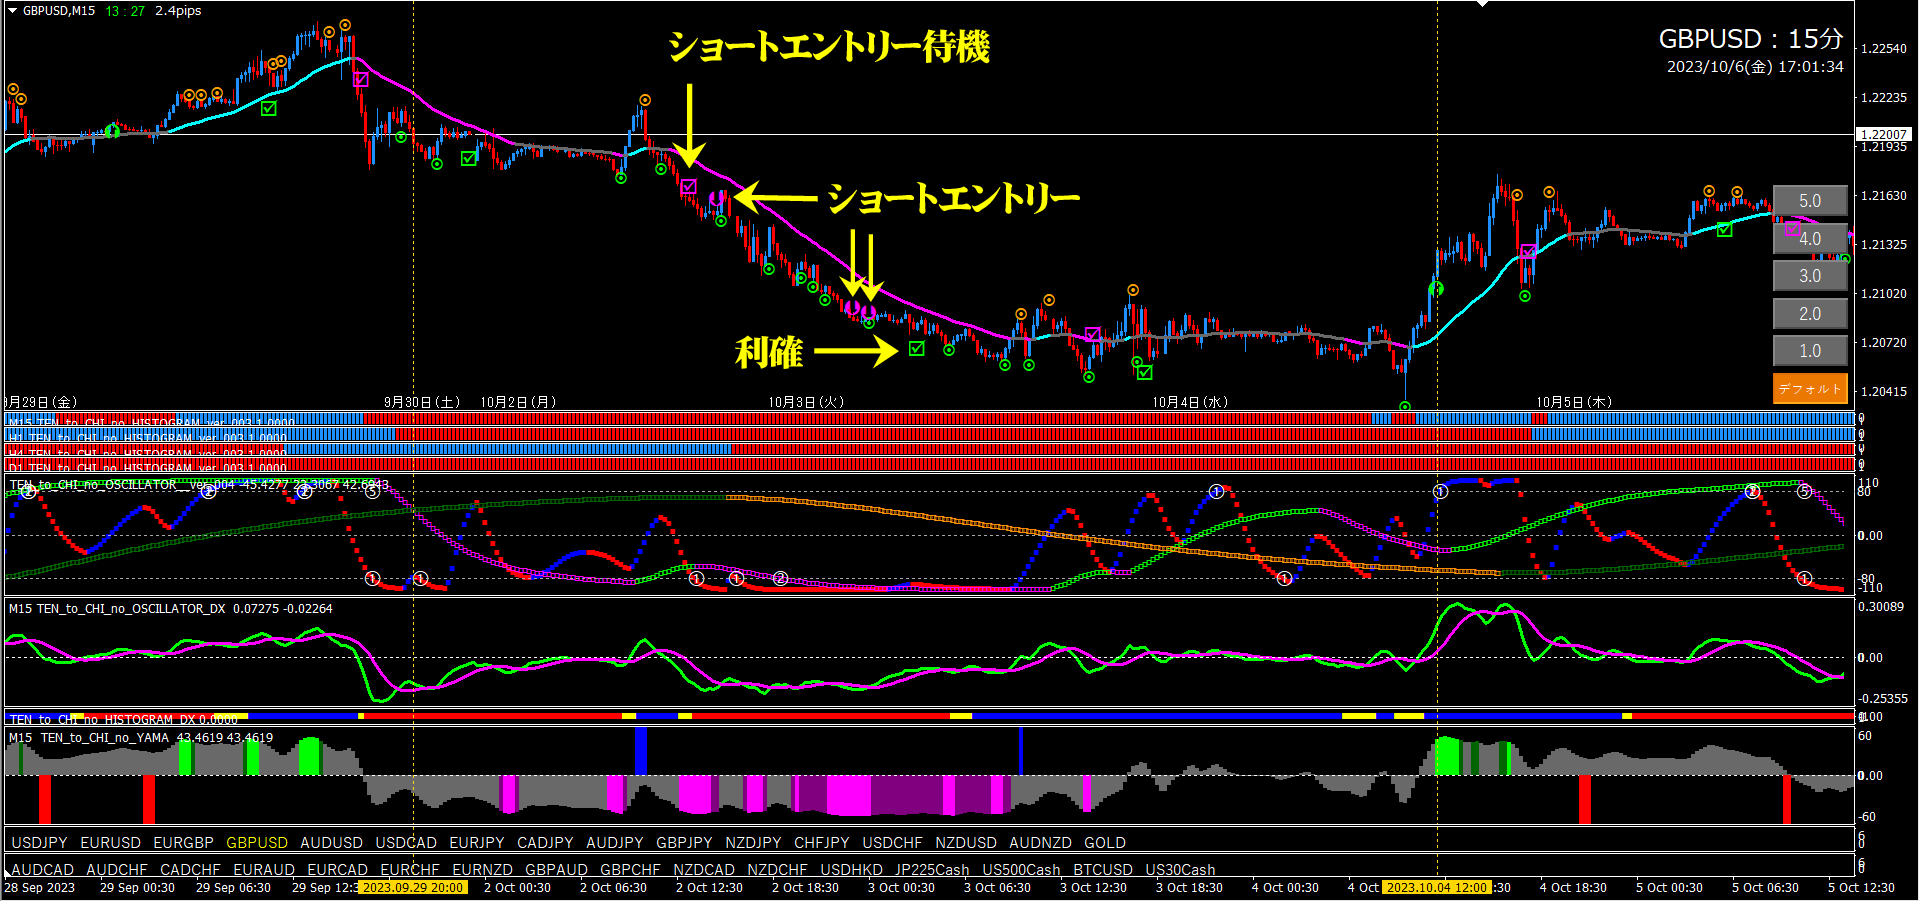
Pound/Dollar15-minute + 4-hour Backtest (from September 29, 2023 to present)
※ Please note the yellow vertical line. The 15-minute chart also has a yellow vertical line in the same location. (Using the LINK LINE)
■ 4-hour chart (Environmental recognition)
The left vertical line indicates where I judged bearish. The right vertical line indicates where I reset bearishness.
As in the previous analysis article, it moved downward as expected.
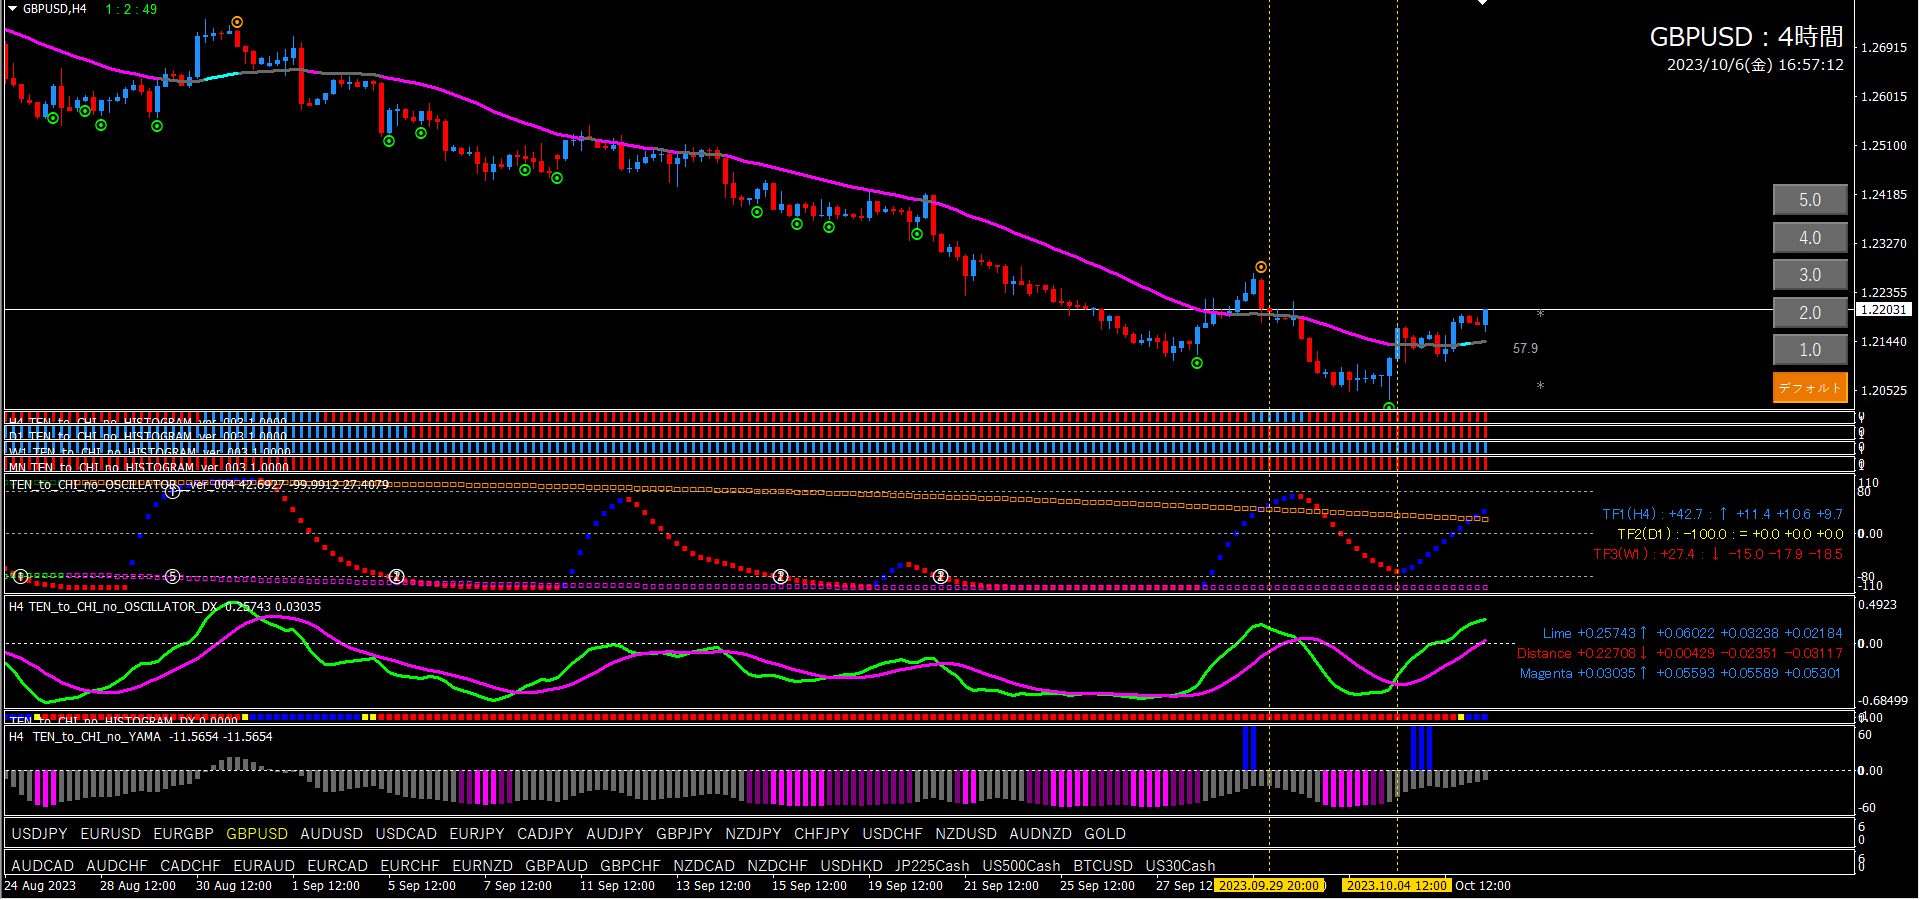
The left vertical line is where I judged bearish on the 4-hour chart. The right vertical line is where I reset bearishness on the 4-hour chart.
Although there are signals for short entries or short valley signals, there aren’t many points where you can capture large moves comfortably. This is common in strong trending conditions. In such cases, the trend-specific signal tool,“Abusan Signal” is extremely effective. This time, a short entry signal appeared at a good location as well.
If the 4-hour chart clearly indicates an uptrend, all long signals on the 15-minute chart from Abusan Signal are valid. (However, follow the trading rules: wait for Abusan Signal 2, then enter on Abusan Signal.)
Regardless of the state of Heaven and Earth Indicators (e.g., Oscillator TF2 not aligning), entering solely with Abusan Signal is the biggest advantage of this method. This method relies on the 4-hour chart analysis making a 15-minute trend highly likely to be present, so Abusan Signals tend to light up, which reduces risk as well.


That’s all.
I hope this is of some help to everyone.
