
Ichimoku Kinko Hyo Introduction • Episode 12: Weekly Real-time B, Y, and the Current Price Line [Supervised by Tetsuo Hosoda (Sanse Ichimoku Yamado)]
【Introduction to Ichimoku Kinko Hyo [Supervised by Sadao Tetsuo (Sanse Ikko Yamabito)] Serialized article (14 total)】
・Chapter 1: The Origin of Ichimoku Kinko Hyo (Free)
・Chapter 2: Three Waves and Time Relationships I
・Chapter 3: Three Waves and Time Relationships II
・Chapter 4: What Can Be Understood from Three Waves, Time Relationships, and Price Relationships
・Chapter 5: Conversion Line and Base Line I
・Chapter 6: Conversion Line and Base Line II
・Chapter 7: Conversion Line and Base Line III
・Chapter 8: Leading Span and Lagging Span I
・Chapter 9: Leading Span and Lagging Span II
・Chapter 10: The 'Pattern' of Preparatory Structure and a 9-Week Chart
・Chapter 11: 9-Week Chart and 9-Month Chart
・Chapter 12: B, Y on the Weekly Real Line and the Interbank Rate Line
・Chapter 13: How to Use B, Y
・Chapter 14: Contents of the Original Text of 'Ichimoku Kinko Hyo'
Chapter 12 Index
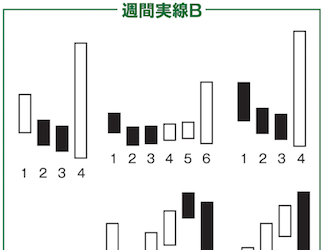
1. The Concept of the Weekly Edition
2. Weekly Real Line B, Y Suggesting Breaks
3. Confirm B, Y on the Weekly Real Line and the 9-Week Chart
4. Confirm B, Y on the Chart
5. Ichimoku Kinko Hyo: Quick Facts
Profile: Tetsuo Hosoda

Hosoda Tessei Co., Ltd. Sanse Ichimo Yamabito. Carrying on the will of Ichimoku Yamabito, engaged in disseminating the correct use of Ichimoku Kinko Hyo. Writes market analysis and line chart courses for the Ichimoku Kinko Hyo Club hosted by Economic Variability Research Institute. Every Monday on Radio Nikkei Market Press, broadcasts 'Technical Analysis from Nikkei Average Ichimoku Kinko Hyo'.
Official Site:Ichimoku Kinko Hyo Official Homepage | Economic Variability Research Institute
Copyright of Ichimoku Kinko Hyo is held by Economic Variability Research Institute Co., Ltd., which publishes the original edition. For purchasing the original edition, please see the official Ichimoku Kinko Hyo homepage.
Services | Official Ichimoku Kinko Hyo Homepage | Economic Variability Research Institute
Chapter 1-2: The Concept of the Weekly Edition
In the previous article, we covered the 9-week chart as described in the 'Ichimoku Kinko Hyo Weekly Edition'. The 9-week chart aggregates the basic 9-number period and visualizes its current progression, effectively a simplified Ichimoku Kinko Hyo.
By the way, in the Weekly Edition, Ichimoku Yamabito states the following:
'Ichimoku Kinko Hyo and its final part are 'broad' (wide). In contrast, the Weekly Kinko Hyo and others are 'concise'. The broad part, academically, is essential and fundamental in its study, but the concise part is practically, instantaneously, very convenient, and usable by even the busiest people.' (Note 1)
Ichimoku Yamabito, 'Ichimoku Kinko Hyo Weekly Edition' (Economic Variability Research Institute Co., Ltd., p. 9 (Note 1))
In short, the study of 'Ichimoku Kinko Hyo' and its 'Final Edition' is important, and the 'Weekly Edition' can be used on top of that. Do not take only the seemingly easy 9-week chart concept and use it in isolation.
Now, this time we will examine the concept of the weekly real line B and Y. As shown in the diagram below, this refers to the appearance and arrangement on the weekly chart, and can be said to be a simplified template of a sideways breakout.
These are used to gauge the market direction, with the 9-week chart and the interbank rate line (discussed later) as supplementary tools; this is the essence of the 'Weekly Edition'.