

【BTCJPY】20180801 Daily Pivot
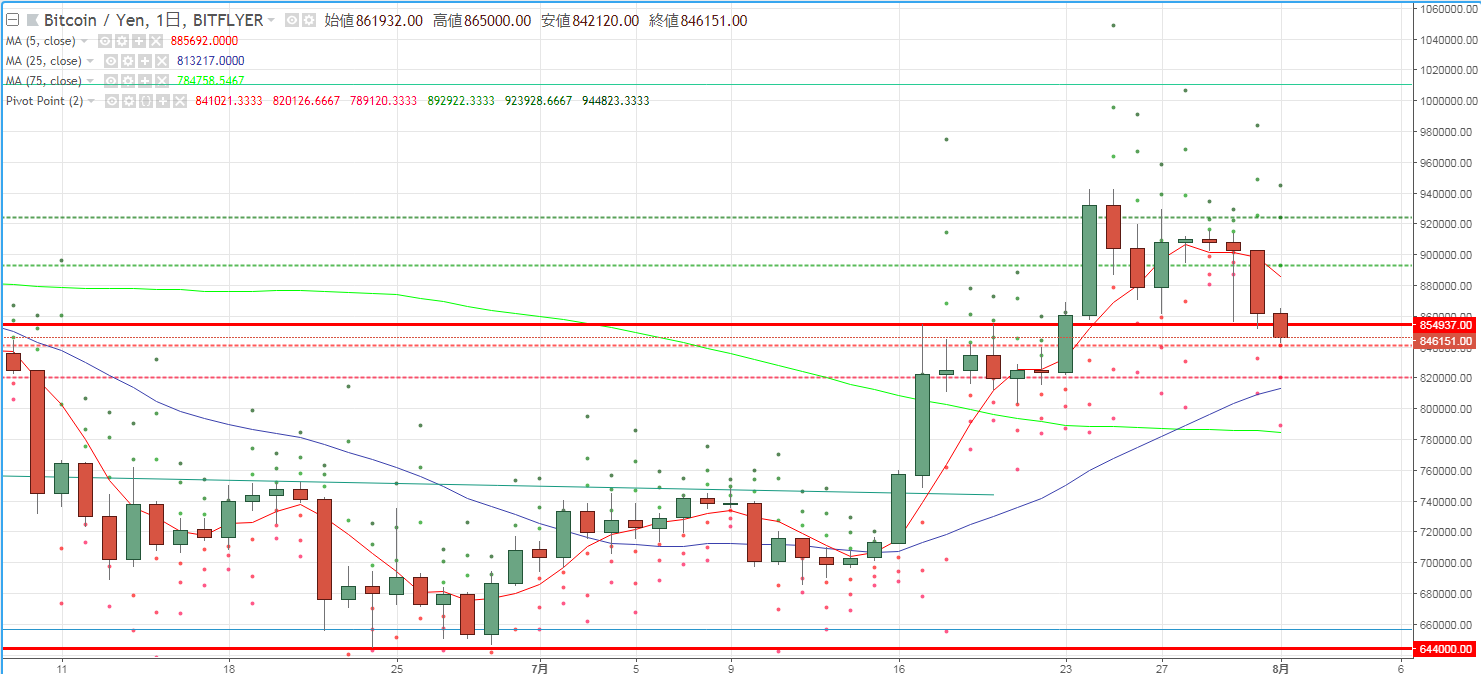
As a guide for day trading BTCJPY, we check pivots. Yesterday (July 31) the selling mood was strong, and the market environment continued to fall without much rise from the open.
R2=923,928
R1=892,922
S1=841,021
S2=820,126
※ A pivot is a technical indicator that predicts the day's price movement range based on the previous day's price action. Centered on the Pivot Point (PP), lines of resistance (R1, R2) above and support (S1, S2) below are drawn, and they are used as guidelines for trading.
【Formula】
Pivot Point (PP) = (Previous day's close + previous day's high + previous day's low) / 3
Resistance Line 1 (R1) = PP + (PP - previous day's low)
Support Line 1 (S1) = PP - (previous day's high - PP)
Resistance Line 2 (R2) = PP + (previous day's high - previous day's low)
Support Line 2 (S2) = PP - (previous day's high - previous day's low)


