

【BTCJPY】20180731 Daily Pivot
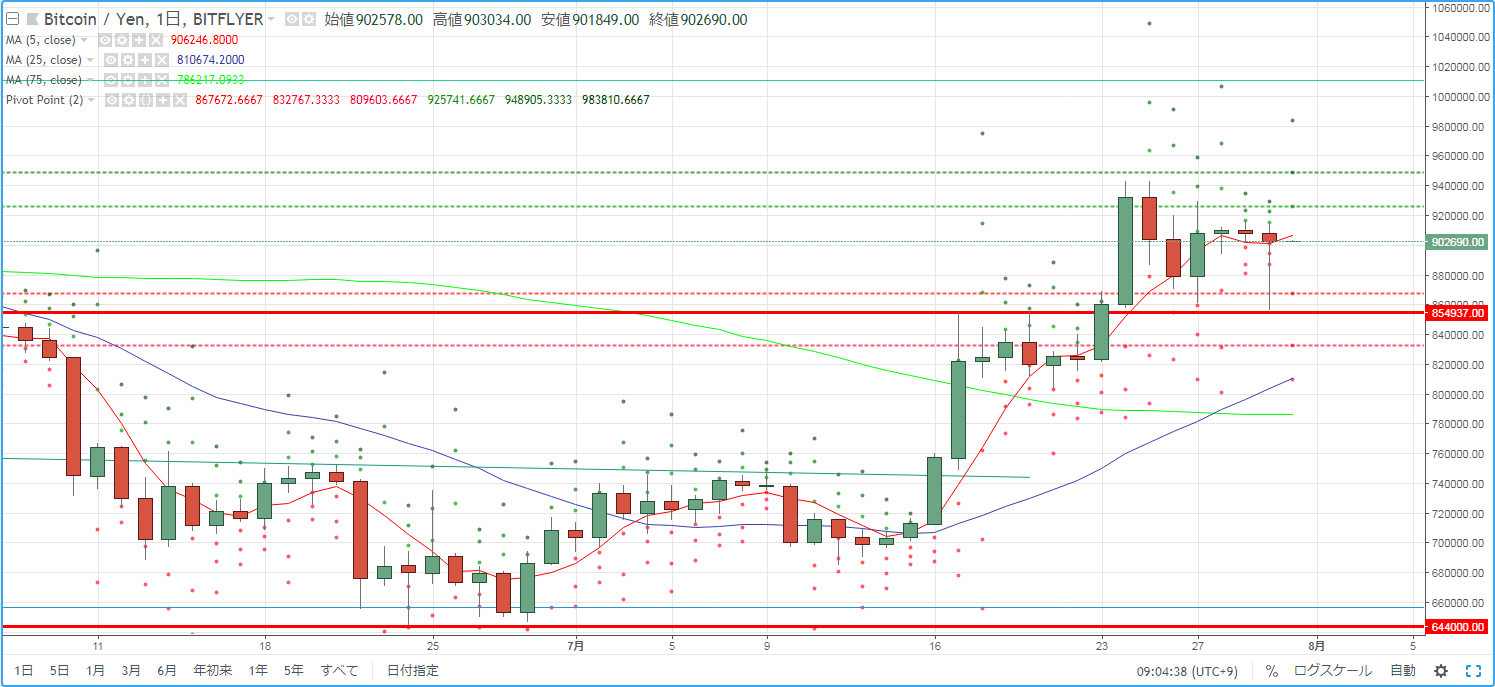
As a guideline for day trading BTCJPY, we confirm the pivot. Yesterday (July 30) the market environment showed a rebound after a long lower wick, but could not surpass the opening price and ended with a bearish candle.
R2=948,905
R1=925,741
S1=867,672
S2=832,767
※ Pivot is a technical indicator that predicts the price movement range for the day based on the previous day's movement. Centered on the Pivot Point (PP), draw resistance lines (R1, R2) and support lines (S1, S2) above and below, and use them as trading guidelines.
【Calculation formula】
Pivot Point (PP) = (previous day's close + previous day's high + previous day's low) / 3
Resistance Line 1 (R1) = PP + (PP - previous day's low)
Support Line 1 (S1) = PP - (previous day's high - PP)
Resistance Line 2 (R2) = PP + (previous day's high - previous day's low)
Support Line 2 (S2) = PP - (previous day's high - previous day's low)


