

【BTCJPY】20180730 Daily Pivot
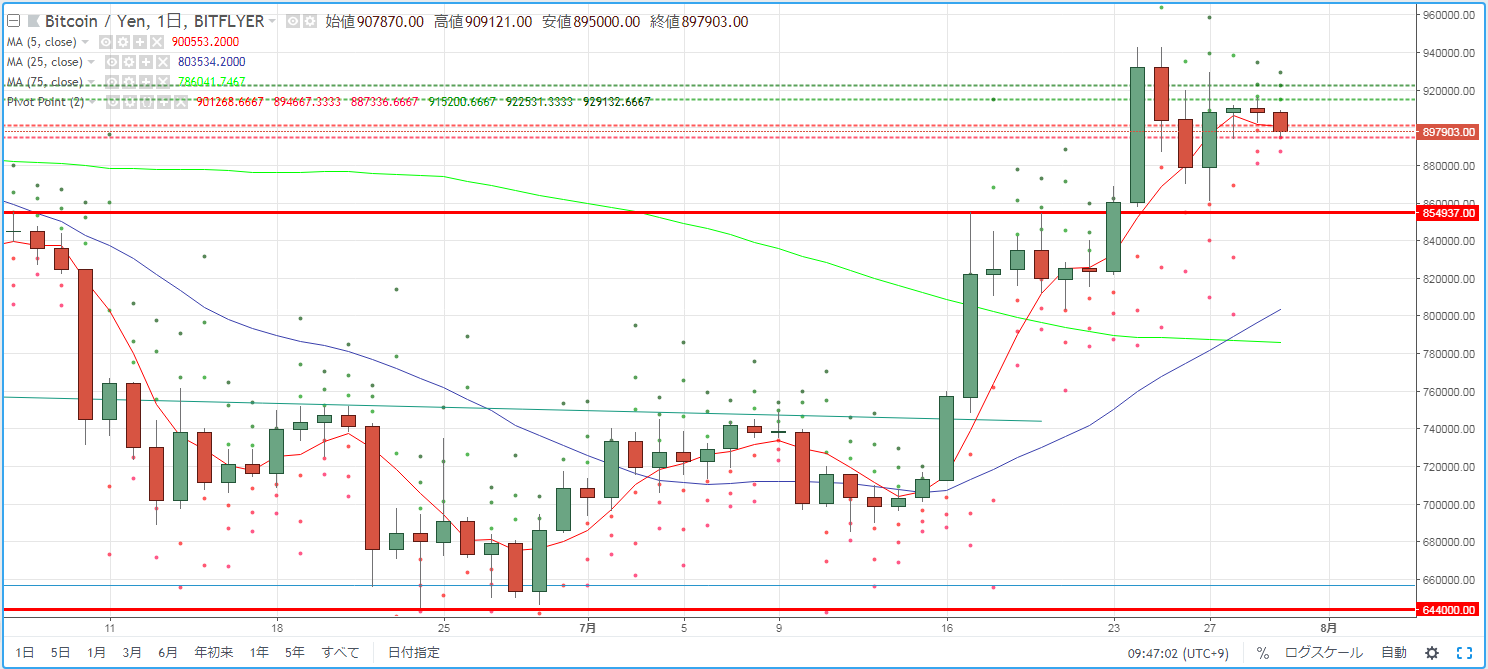
As a guideline for day trading BTCJPY, we check the pivot. Yesterday (July 29) the market environment remained in a narrow price range, continuing the day before's subdued movement.
R2=922,531
R1=919,200
S1=901,268
S2=894,667
※ A pivot point is a technical indicator that predicts the range of price movement for the day based on the previous day's activity. Centered on the Pivot Point (PP), draw resistance lines (R1, R2) above and below, and support lines (S1, S2) below, using them as trading guides.
【Calculation formulas】
Pivot Point (PP) = (Previous day's close + high + low) / 3
Resistance Line 1 (R1) = PP + (PP - previous day's low)
Support Line 1 (S1) = PP - (previous day's high - PP)
Resistance Line 2 (R2) = PP + (previous day's high - previous day's low)
Support Line 2 (S2) = PP - (previous day's high - previous day's low)


