

【BTCJPY】20180729 Daily Pivot
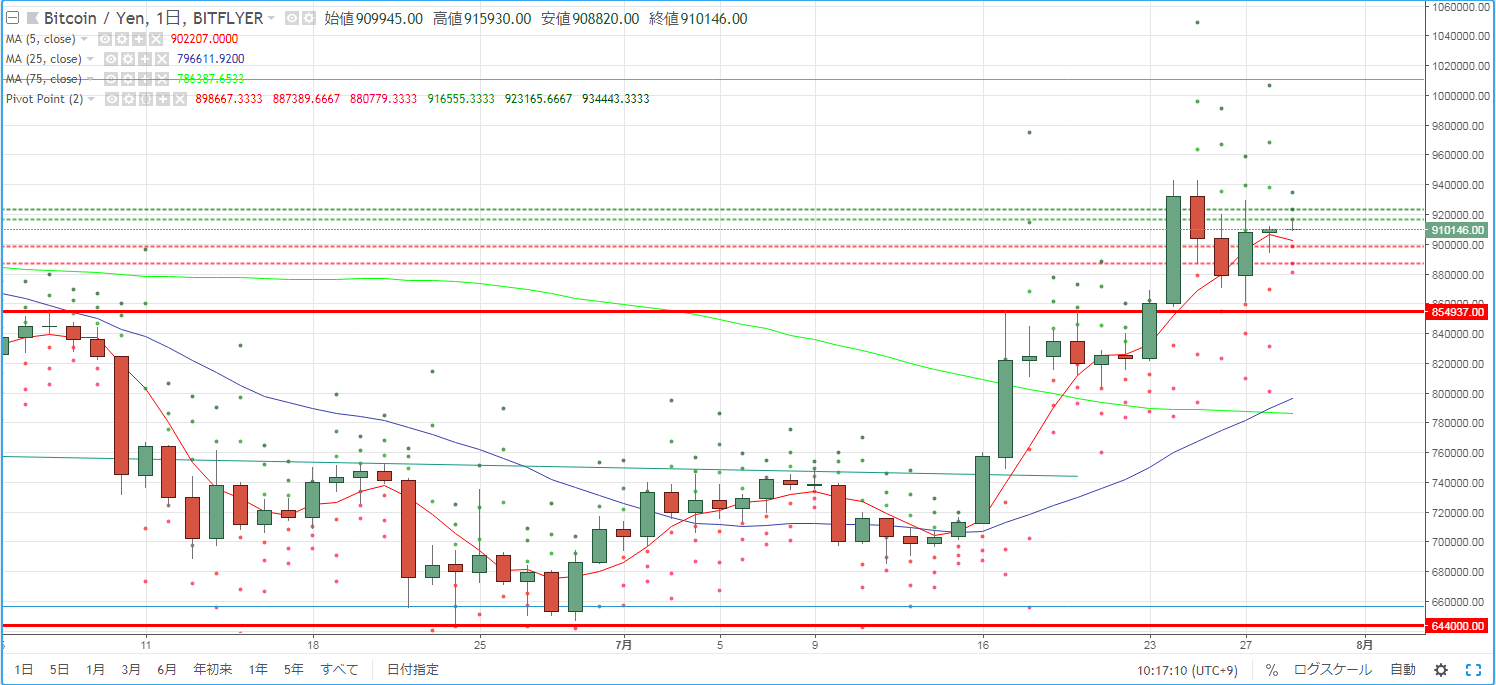
As a guide for day trading BTCJPY, we check the pivot. On the 28th, the market environment shifted from a wide price range to a small bullish candle, forming a narrow trading range.
R2=923,165
R1=916,555
S1=898,667
S2=887,389
※ A pivot is a technical indicator that forecasts the day's price movement based on the previous day's price action. Centered on the Pivot Point (PP), resistance lines (R1, R2) and support lines (S1, S2) are drawn above and below, and they are used as trading guideposts.
【Calculation formula】
Pivot Point (PP) = (Previous close + Previous high + Previous low) / 3
Resistance Line 1 (R1) = PP + (PP - Previous low)
Support Line 1 (S1) = PP - (Previous high - PP)
Resistance Line 2 (R2) = PP + (Previous high - Previous low)
Support Line 2 (S2) = PP - (Previous high - Previous low)


