

【XRPJPY】Large Descending Triangle
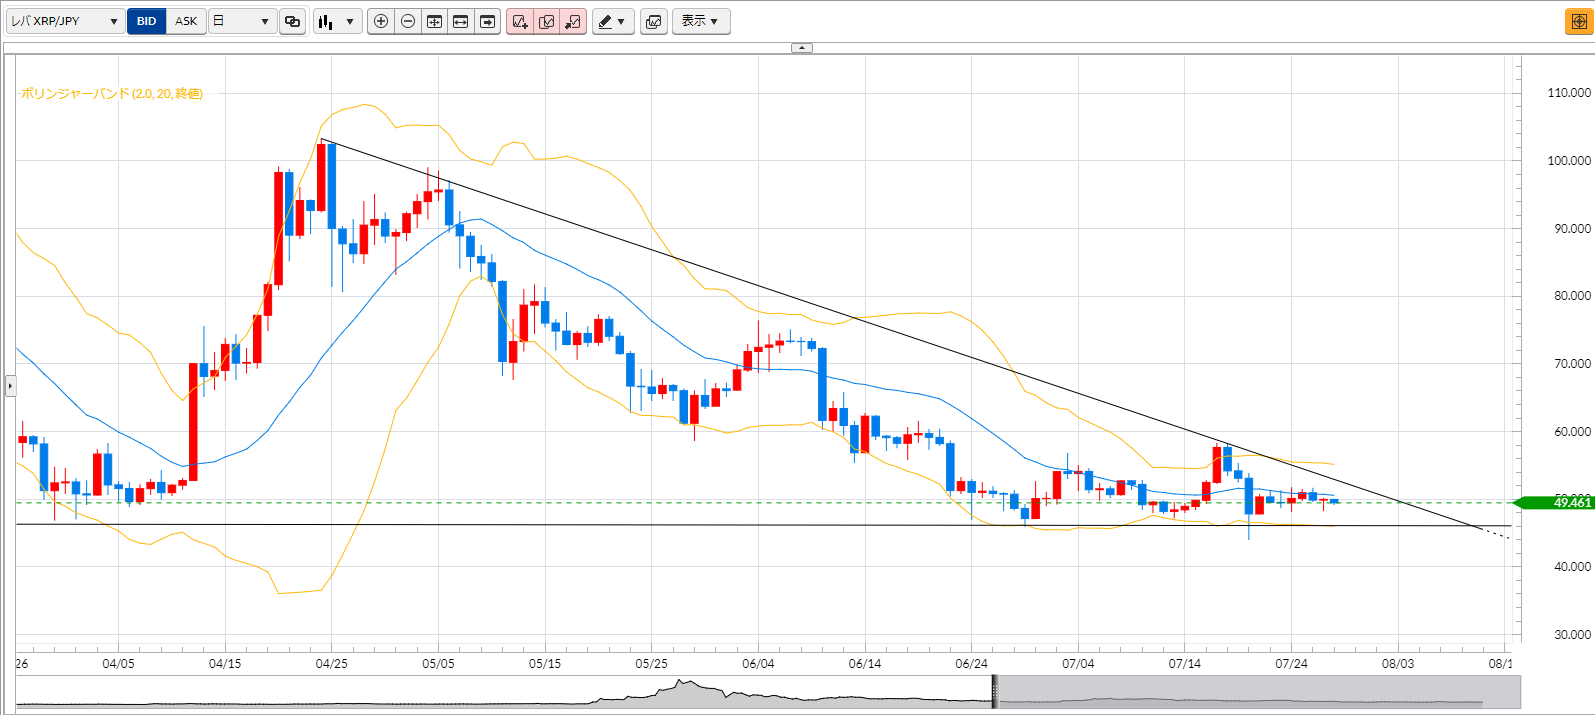
On the daily chart, a large descending triangle appears to be forming. A descending triangle is a triangle where the highs are lowered and the structure is supported by a strong horizontal line. With selling pressure increasing, it tends to push the highs lower, ultimately aiming for a break of the horizontal line. Although this chart pattern primarily appears in corrective waves, here we are viewing it from a broader perspective. There was a moment on July 20 when the support line was broken, but the price optioned back up even with a lower wick. What will happen when the support line is tested again? It seems solid at the bottom due to the large descending triangle, but attention should be paid to this battle.
× ![]()


