

【BTCJPY】How to read the four-hour chart range?
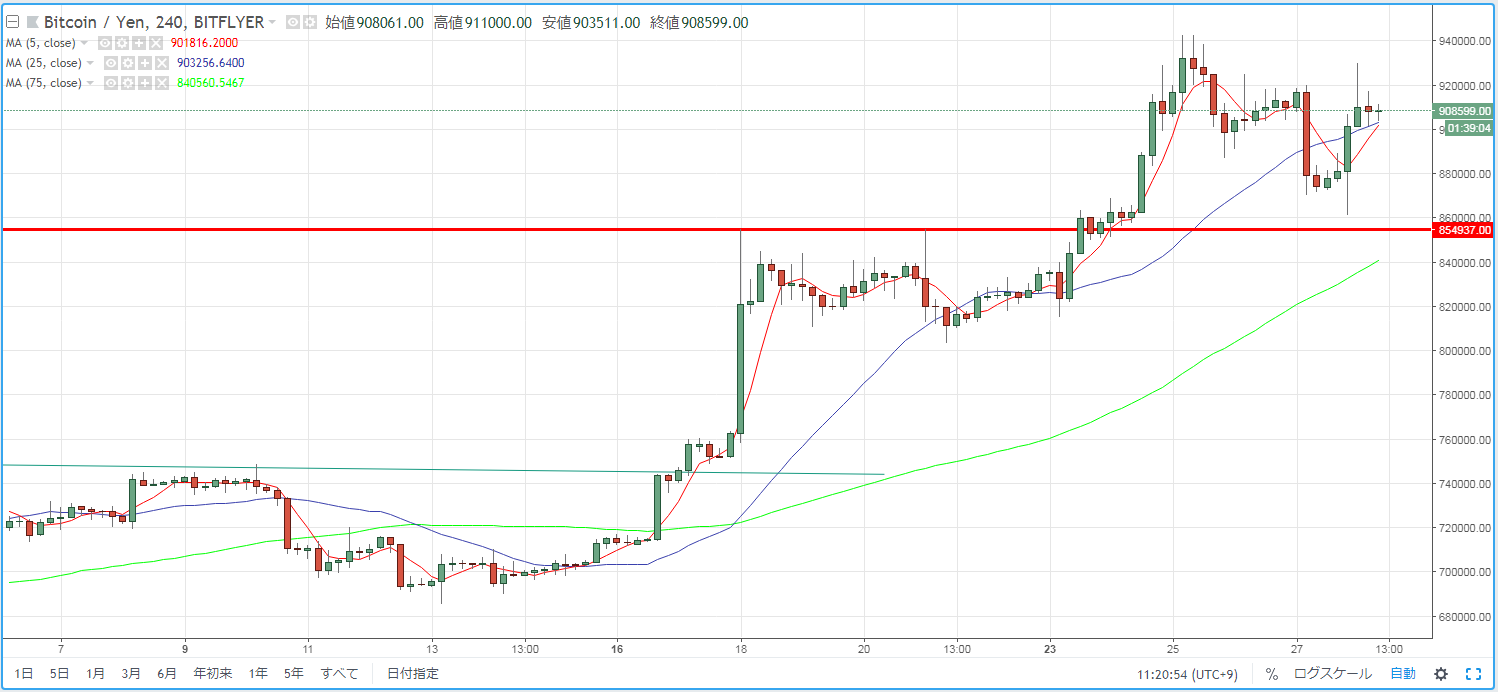
In the July 27 post titled "【BTCJPY】 From the Peak to a Drop after the Pin Bar," I mentioned focusing on the direction after forming a pin bar on a daily basis. The 27th ended with a bullish candle, so now let's check the 4-hour chart. The price is making lower lows, but the highs are not being pushed lower; in other words, it’s moving within a range. This can be understood as a consolidation around about 1,000,000 yen, with roughly a 50,000 yen range up and down. Therefore, the main point of interest for a while will be which direction this range will break out to.
× ![]()


