

【BTCJPY】20180728 Daily Pivot
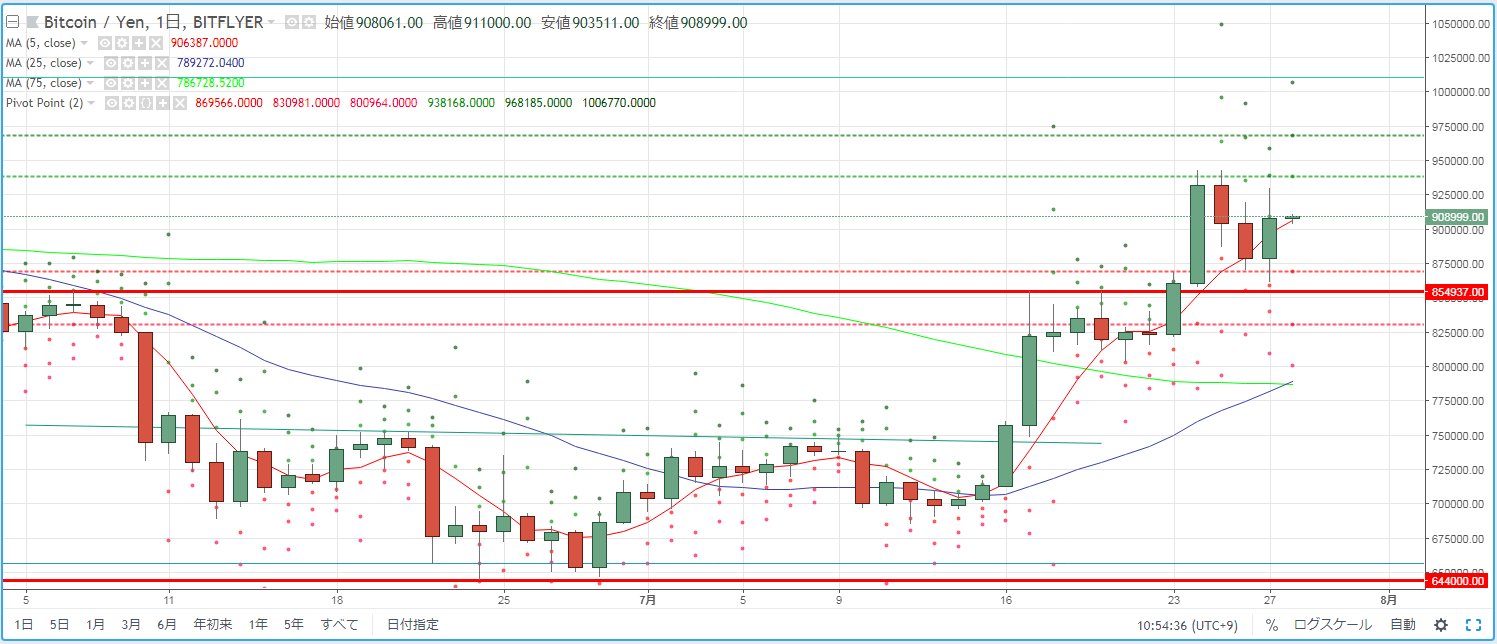
As a guideline for day trading BTCJPY, we verify pivot points. After a trend that formed two consecutive bearish candles on the 25th and 26th, it fluctuated up and down, but ultimately the market environment formed a bullish candle.
R2=968,185
R1=938,168
S1=869,566
S2=830,981
※ A pivot point is a technical indicator that predicts the price movement for the day based on the previous day's price action. Centered on the Pivot Point (PP), draw resistance lines (R1, R2) and support lines (S1, S2) above and below, and use them as trading references.
【Calculation formulas】
Pivot Point (PP) = (Previous day's close + previous day's high + previous day's low) / 3
Resistance Line 1 (R1) = PP + (PP - previous day's low)
Support Line 1 (S1) = PP - (previous day's high - PP)
Resistance Line 2 (R2) = PP + (previous day's high - previous day's low)
Support Line 2 (S2) = PP - (previous day's high - previous day's low)


