

【BTCJPY】20180727 Daily Pivot
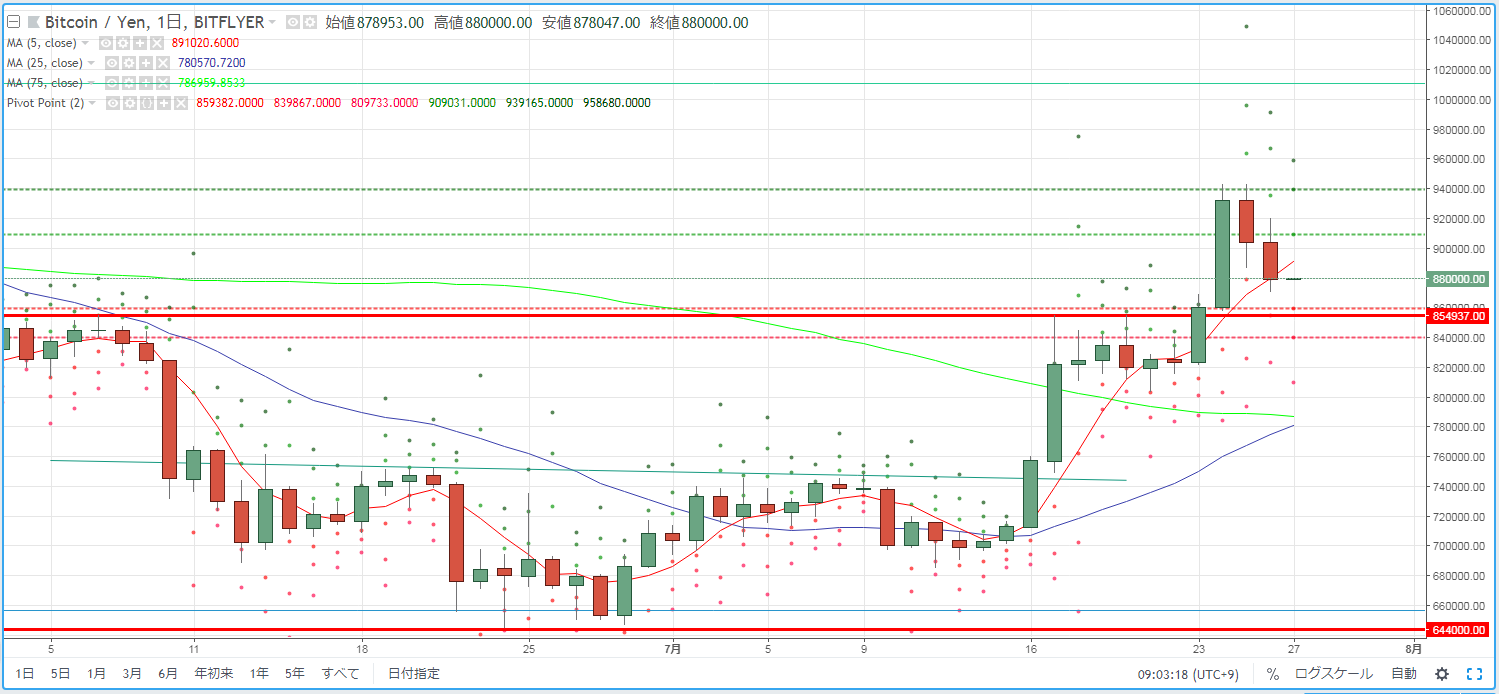
As a guideline for day trading BTCJPY, we confirm pivots. Yesterday (July 26) the market environment was a downtrend that continued from the day before, breaking below the 5-day moving average.
R2=939,165
R1=909,031
S1=859,382
S2=839,867
※ A pivot is a technical indicator that predicts the price movements for the day based on the previous day's price action. Centered on the Pivot Point (PP), resistance lines (R1, R2) and support lines (S1, S2) are drawn above and below, and they are used as guides for trading.
【Calculation】
Pivot Point (PP) = (Previous day's close + previous day's high + previous day's low) / 3
Resistance Line 1 (R1) = PP + (PP - previous day's low)
Support Line 1 (S1) = PP - (previous day's high - PP)
Resistance Line 2 (R2) = PP + (previous day's high - previous day's low)
Support Line 2 (S2) = PP - (previous day's high - previous day's low)


