

【BTCJPY】New development after the inverted head and shoulders
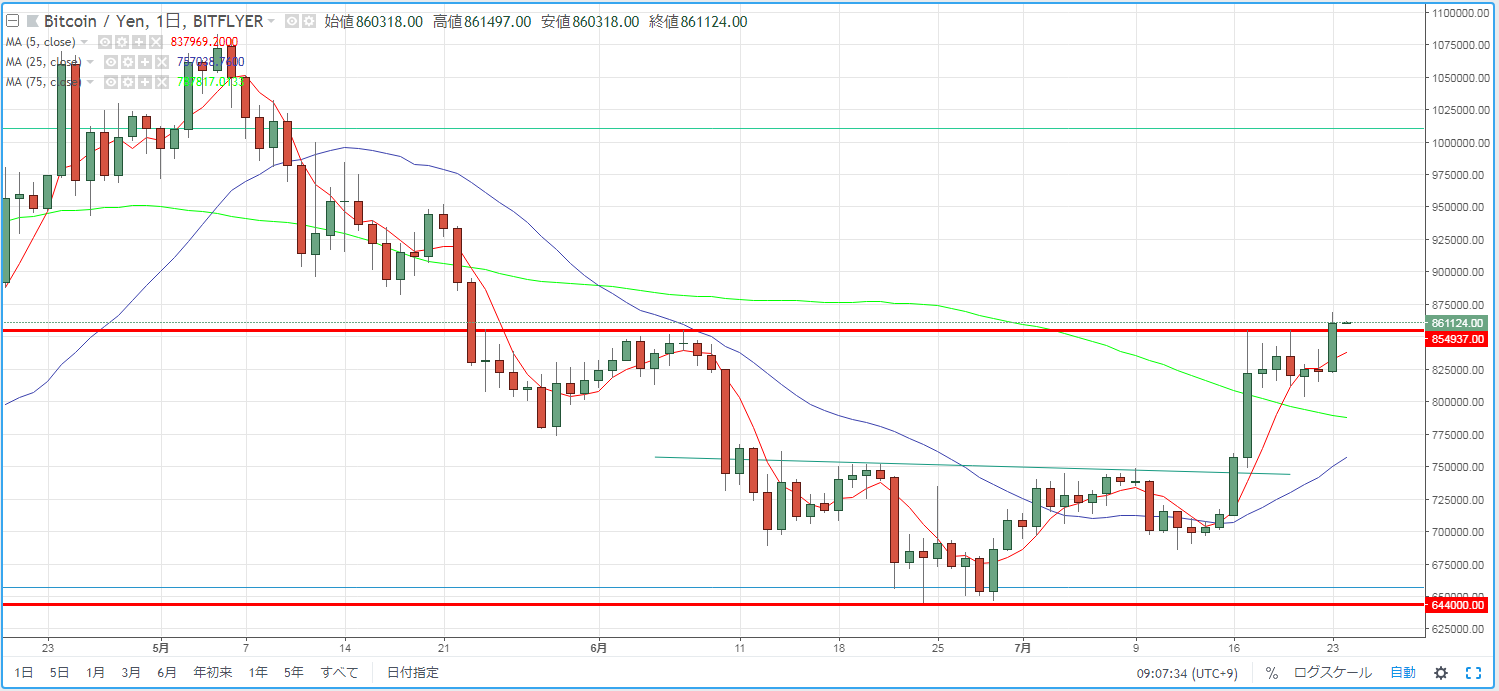
In the post dated July 23, "Will the break above the 20-week moving average on BTCJPY mark the start of an uptrend?" I stated that the weekly chart appears to be in a phase where it would break above the 20SMA. On the daily chart, the pattern has been a reverse head-and-shoulders → neckline break → target after the breakout, with the price stalling around the approximately 850,000 yen level as a recent high. If this level is supported, the groundwork for a genuine rise could be in place. That said, the 75SMA remains pointed downward. I want to pay attention to the recent price action over the next few days, where the 25SMA could potentially form a golden cross.
× ![]()


